1. Analysis Results and Conclusions
This is the race pace analysis which considers fuel loads, tyre degradations, and other contexts of the race.
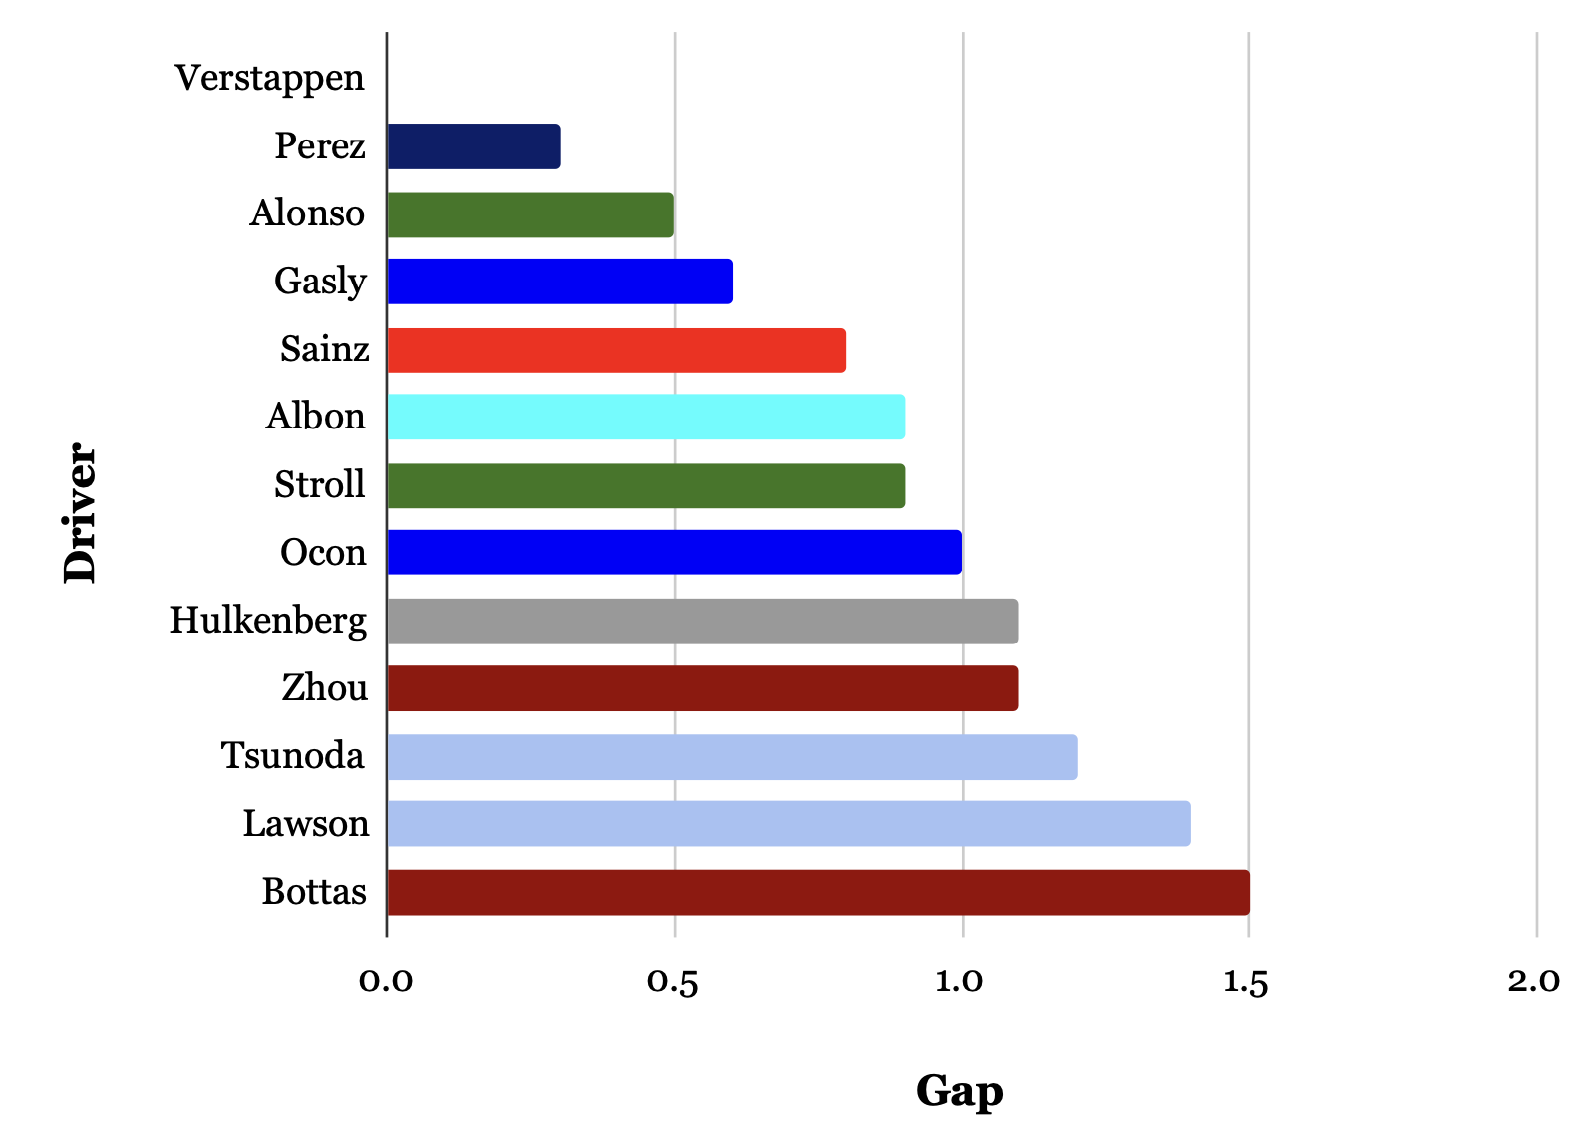
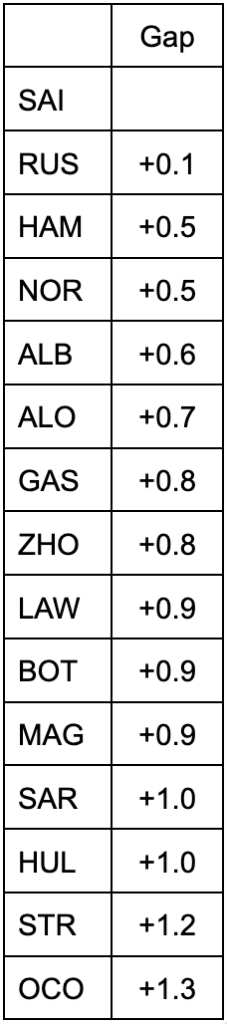
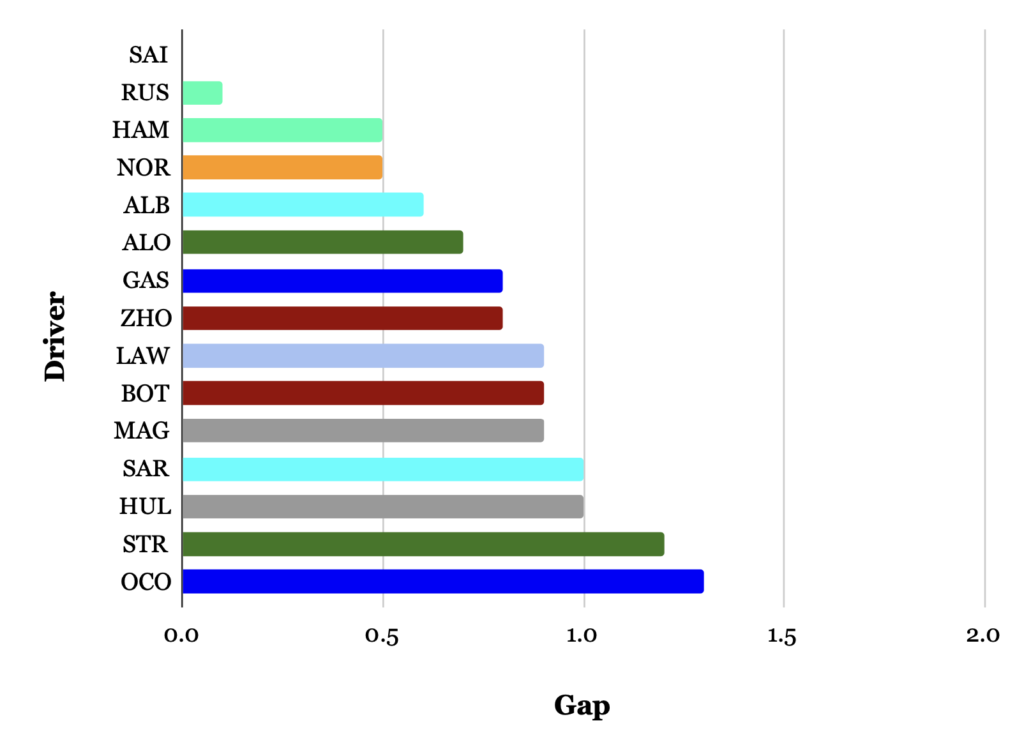
Table 1 and Fig.1 shows power relationship of each car’s race pace in dry conditions. This time, only the race pace on soft tyres could be calculated, so this is the overall race pace analysis result.
Table 1-1 Race pace on medium tyres 1
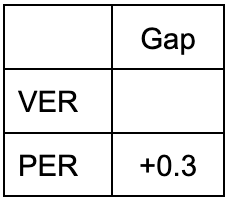
Table 1-2 Race pace on medium tyres 2
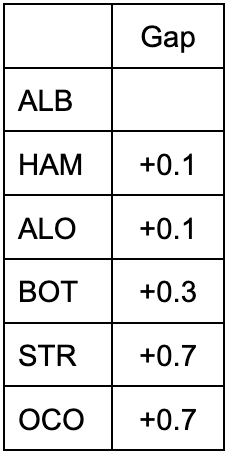
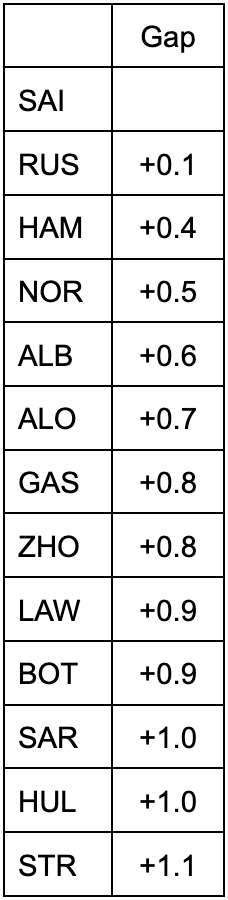
Table 2 Race pace on hard tyres
And we got Fig.3 by taking all of these tables together.
Table 3-1 Overall race pace (except from Red Bulls)
☆Points to note
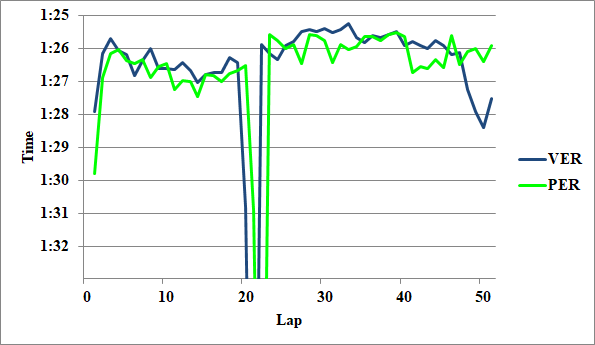
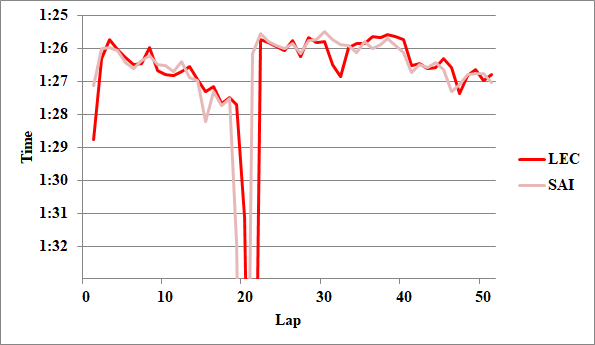
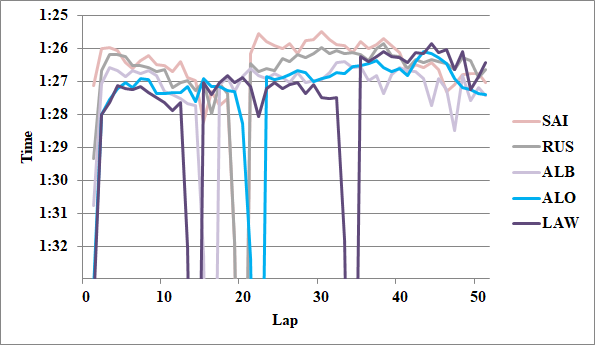
This time, the dirty air had a big impact on the top runners, and it was impossible to compare Verstappen and Perez quantitatively with other drivers. Also, Sainz and Russell, who had clear air in the first stint, were changing their lines to block their rivals, so it was also inappropriate to evaluate their pace as their original pace.
Qualitatively, it was clear that Leclerc was faster than Sainz, and Perez was faster than Leclerc. Similarly, for the McLaren drivers, it was certain that they were faster than Albon on medium tires.
Looking back at the race pace
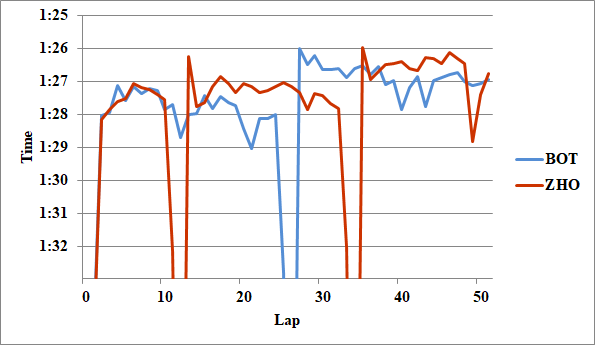
Taking into account the above points, it can be assumed that the Red Bull drivers, especially Verstappen, had an overwhelming pace advantage this time as well.
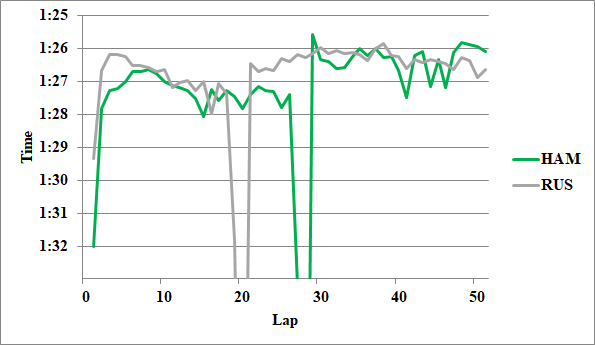
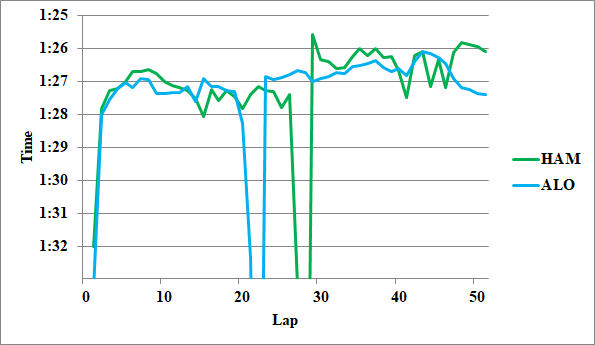
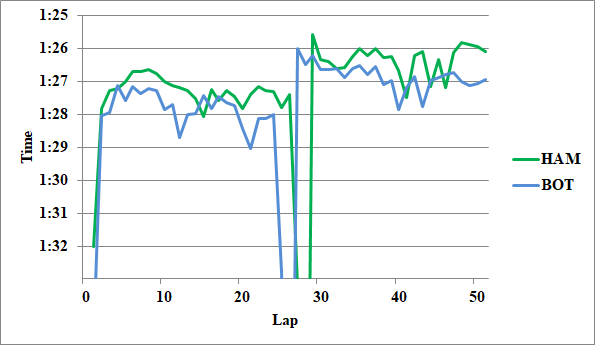
Hamilton had won all his teammates in race pace so far this season with Alonso, but he finally lost. His pace on medium tires in the second half was bad, although it was not noticeable because of the difference in tyre history. His stint on hard tyres in the first half was decent.
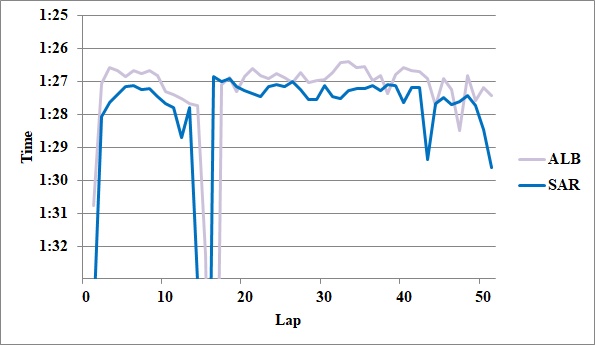
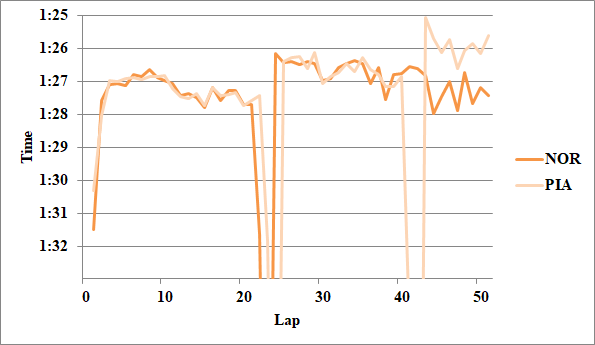
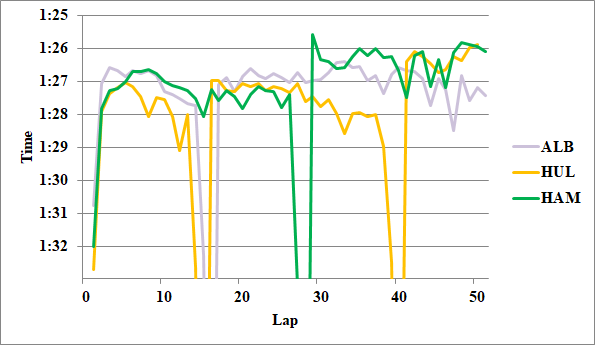
McLaren also had a great harvest, as Norris showed the same speed as Hamilton, surpassed Williams on a circuit with many long straights, and clearly ahead of Aston Martin.
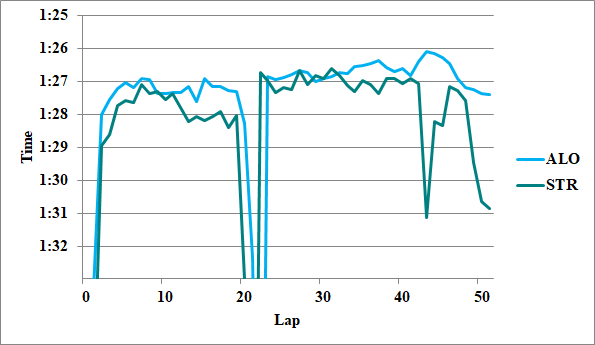
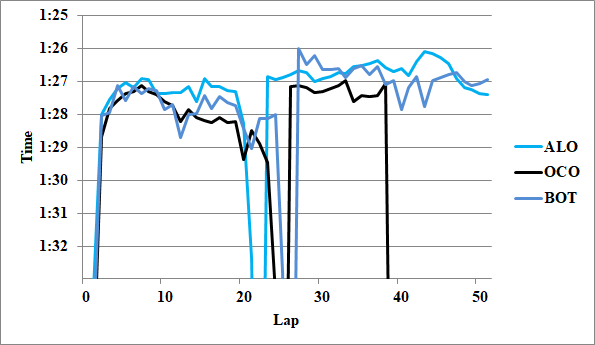
Aston Martin’s Stroll’s lack of pace was noticeable, but the difference between Alonso and Stroll has been around 0.4 seconds this season, which is no different from Massa, Fisichella, Ocon and others. I think it is wrong to rate Stroll as a slow driver. Massa is a driver who can fight for the title until the final race if given a good machine, and I think that the current slump is due to the decline in machine performance.
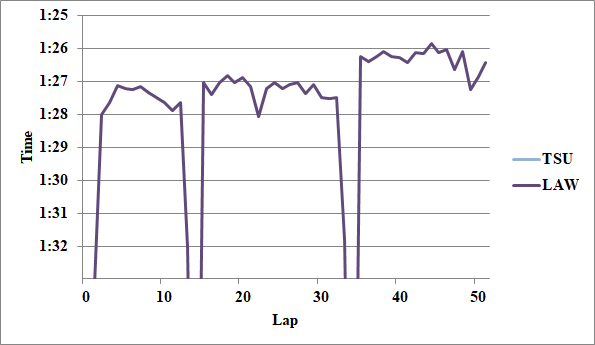
Also, Lawson showed a great drive. This season’s AlphaTauri has a characteristic that performs beteer in race than in qualifying, and if Tsunoda had been driving and he was 0.2 seconds faster than Lawson, he would have had a high chance of finishing in the top 10 regardless of one-stop or two-stops.
2. About the Analysis Method
I assumed a fuel effect of 0.06 [s/lap] and calculated the degradation value from the slope of the graph. I derived the race pace in equal conditions from the tyre history. I also took into account clear/dirty air and the context of the race.
The tyres used by each driver (from Pirelli Official)
Also, if a driver was in dirty air in the first half of a stint but in clear air from the middle, and even in dirty air in the first half he was able to save his tyres and did not slow down excessively, I treated the whole stint as if it were clear air. I defined this condition as open-end clear air (OEC).
This time, I ignored the difference between soft tyres used in qualifying and new soft tyres, and scrubbed and new medium/hard tyres.
3. Appendix
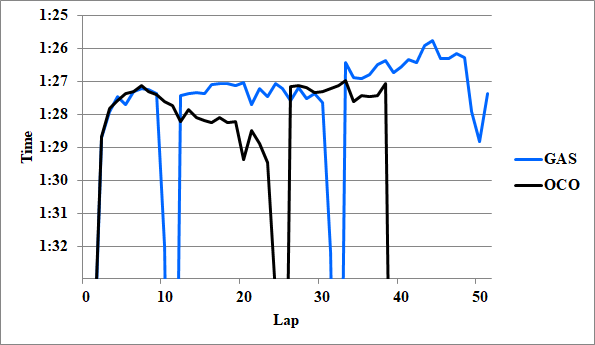
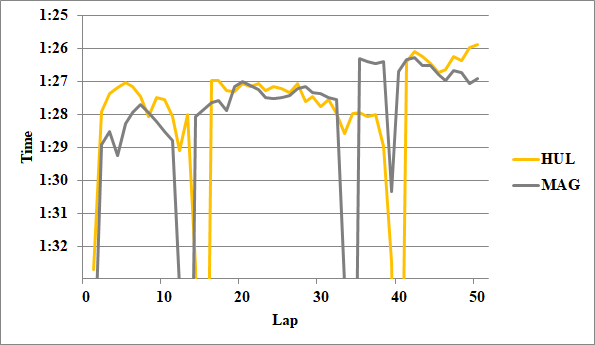
For reference, I attached the graphs I used for analysis.

Writer: Takumi