1. Analysis Results and Conclusions
This is the race pace analysis which considers fuel loads, tyre degradations, and other contexts of the race.
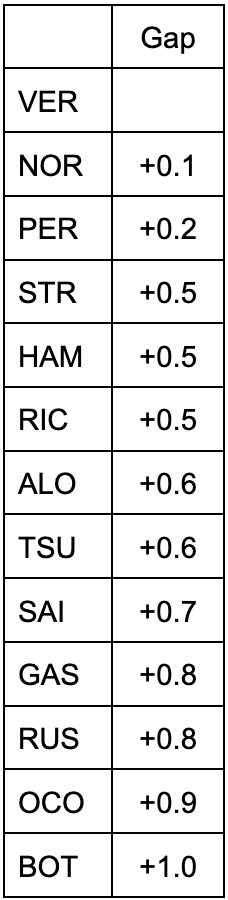
Table 1 and 2 shows power relationship of each car’s race pace in dry conditions.
Table 1 Race pace on soft tyres
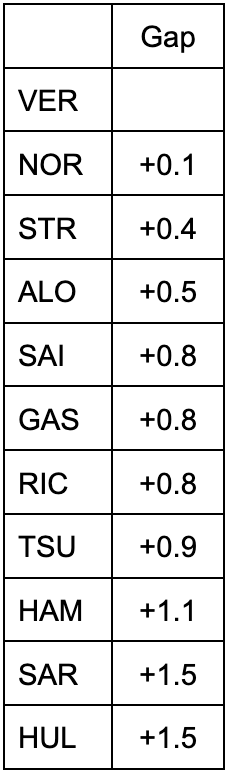
Table 2 Race pace on medium tyres
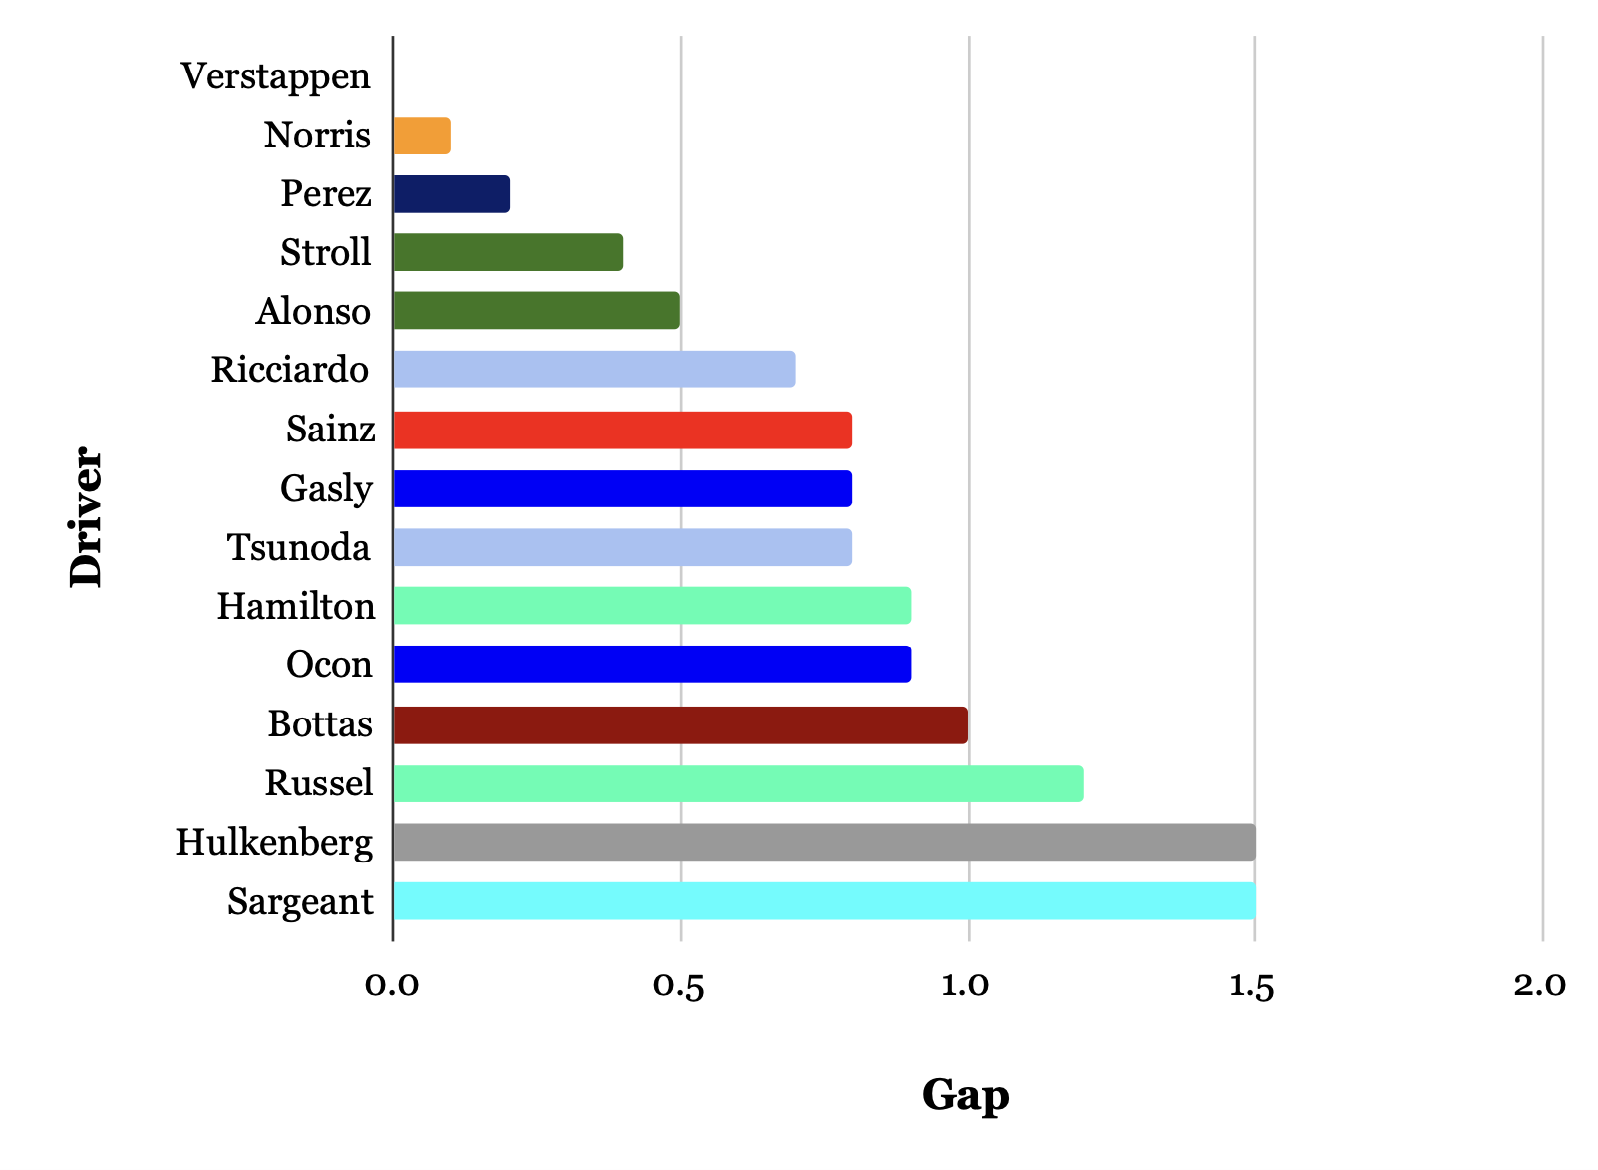
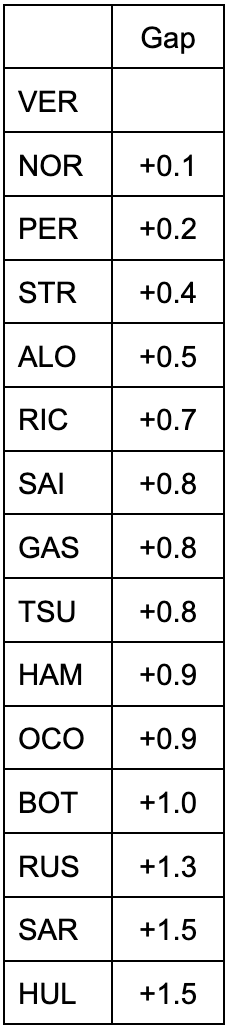
And we got Fig.3 by taking all of these tables together.
Table 3 Overall race pace

Points to note
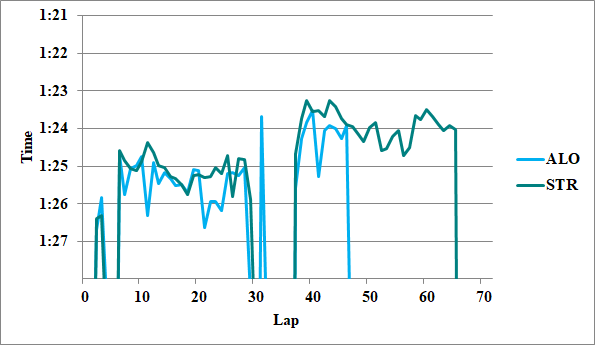
There are two ways to look at Alonso’s pace in the third stint: one is to see it as having the same competitiveness as his first stint, and the other is to see it as the same as his second stint. In this analysis, we thought that the latter interpretation was more natural, considering the relationship between Alonso and Perez, the relationship between other drivers and Alonso as a reference, and the inconsistency of Mercedes’ performance. Based on that assumption, we calculated the pace of Sainz, Gasly, and Sargent based on Alonso’s pace.
Under that assumption, Table 1 shows that Alonso’s first stint was 0.4 seconds slower than Verstappen, and his third stint was 0.6 seconds slower, and Stroll’s first stint had no valid data, so we reflected the 0.1 second difference with Alonso, which was consistent in his second and third stints.
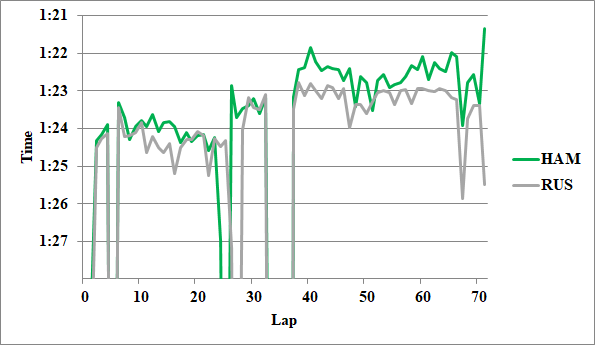
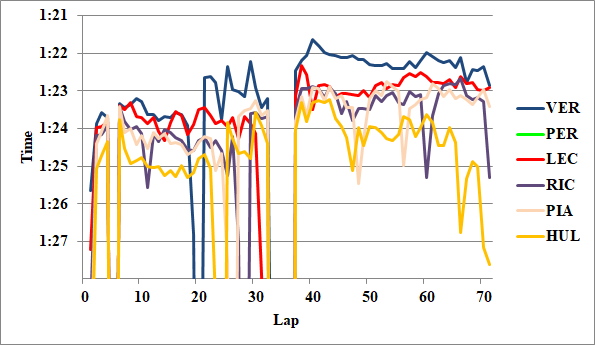
Also, Hamilton’s first stint was 1.0 seconds slower than Verstappen, and his third stint was 1.2 seconds behind, and we used the average of these values in Table 1.
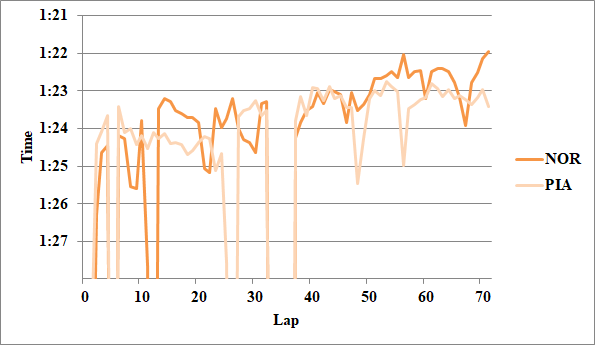
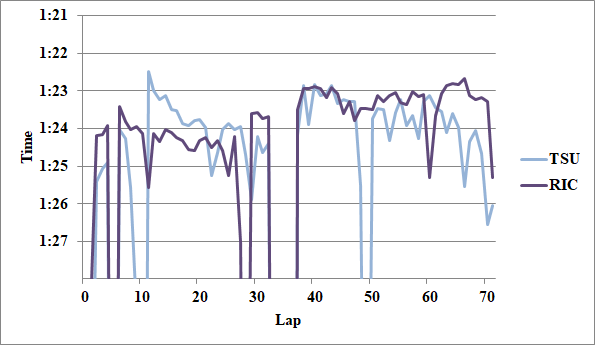
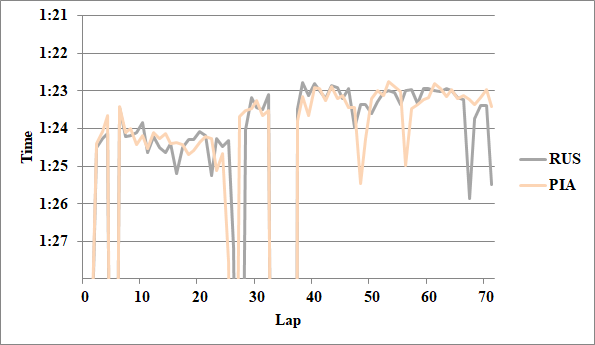
Also, Piastri was excluded from the comparison because of the damage, and similarly, Tsunoda’s final stint was also excluded from the calculation, considering the impact of the clutch issue.
Looking Back at the Race Pace
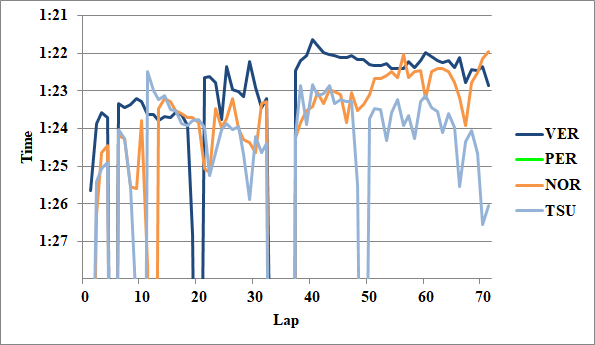
The pace difference between Verstappen and Norris was consistently 0.1 seconds until the second stint, and they were very close. However, it was impressive that Verstappen steadily widened the gap in that situation.
Looking at Hamilton’s pace, Mercedes had the third best competitiveness in the second stint, behind Red Bull and McLaren, but their pace on the softs was disastrous. It was a case of Mercedes’ character in the last two years, which is “very fast in some conditions, but helpless in others”.
Aston Martin has completely recovered, and it was interesting to see Stroll show a high level of competitiveness. Alonso was also running more defensively against Perez than his own pace, but he was still at a level comparable to Alonso, and we are looking forward to next season and beyond.
The AlphaTauri drivers also showed good pace, but in the race, Aston Martin and Alpine were able to show their power, so it was a bit of a tough situation, but Ricciardo showed a pace that was equal to Gasly, and we would have liked to see a clean race from a decent position in the first place.
2. About the Analysis Method
I assumed a fuel effect of 0.04 [s/lap] and calculated the degradation value from the slope of the graph. I derived the race pace in equal conditions from the tyre history. I also took into account clear/dirty air and the context of the race.
The tyres used by each driver (from Pirelli Official)
Also, if a driver was in dirty air in the first half of a stint but in clear air from the middle, and even in dirty air in the first half he was able to save his tyres and did not slow down excessively, I treated the whole stint as if it were clear air. I defined this condition as open-end clear air (OEC).
This time, I ignored the difference between soft tyres used in qualifying and new soft tyres, and scrubbed and new medium/hard tyres.
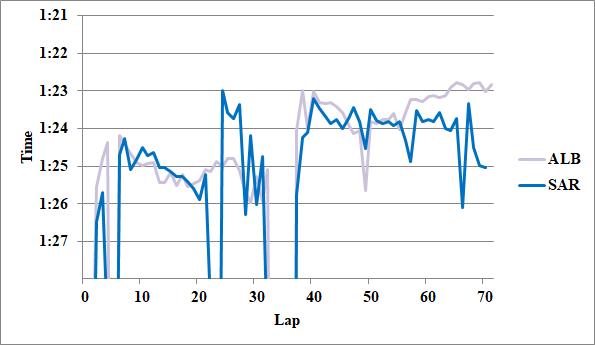
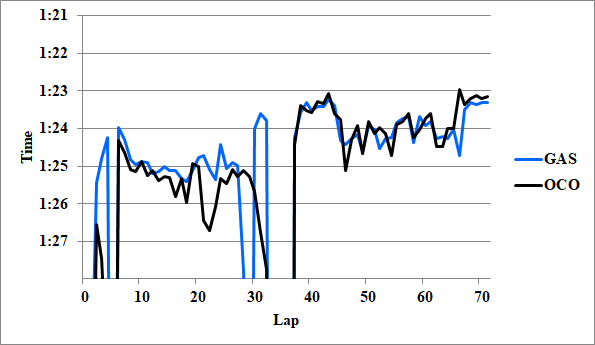
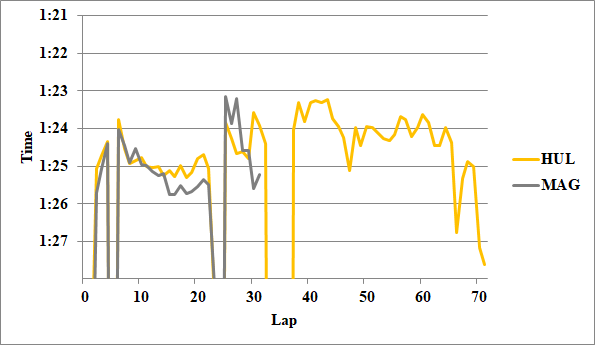
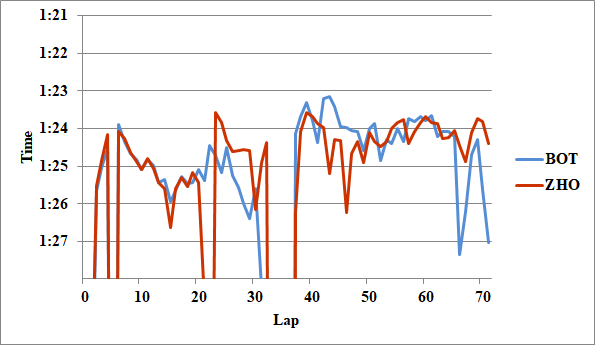
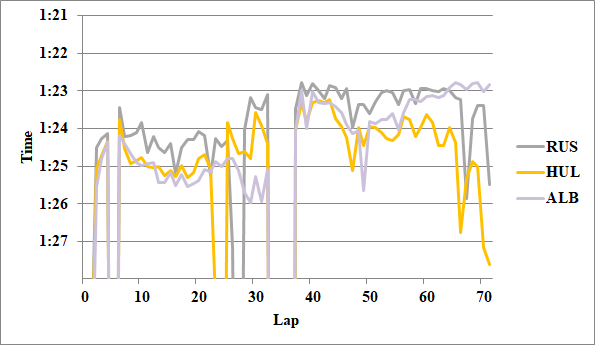
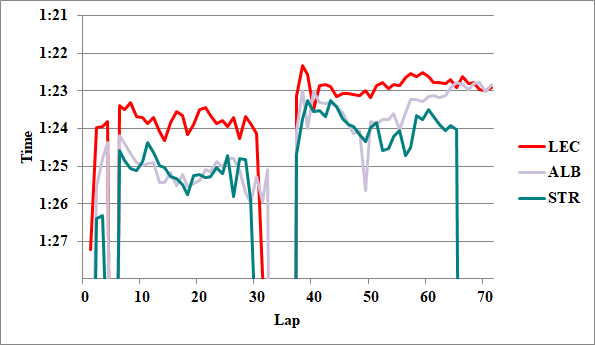
3. Appendix
For reference, I attach the graphs I used for analysis.
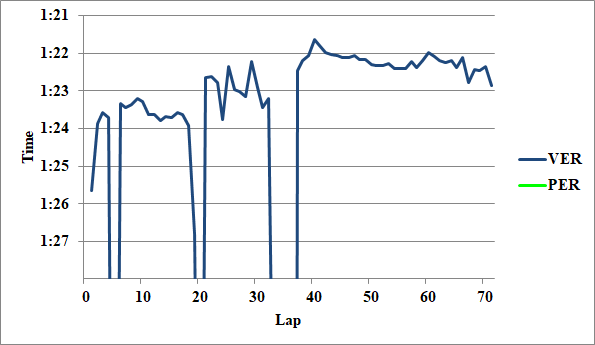

Writer: Takumi