1. Analysis Results and Conclusions
This is the race pace analysis which considers fuel loads, tyre degradations, and other contexts of the race.
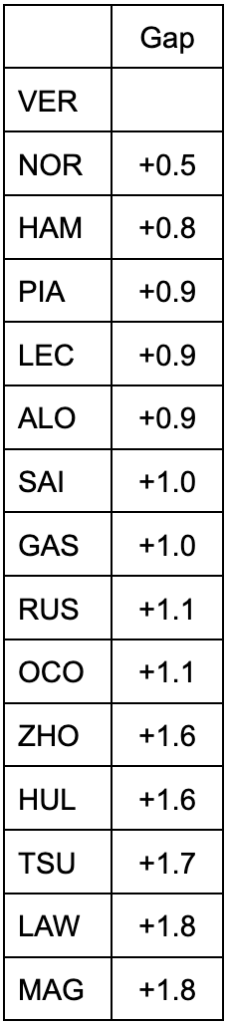
Table 1 and 2 shows power relationship of each car’s race pace in dry conditions.
Table 1-1 Race pace on medium tyres 1
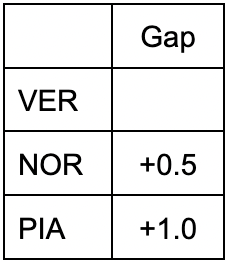
Table 1-2 Race pace on medium tyres 2
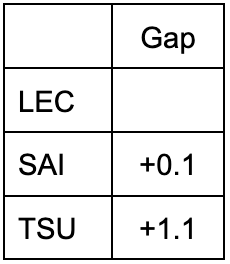
Table 2 Race pace on hard tyres
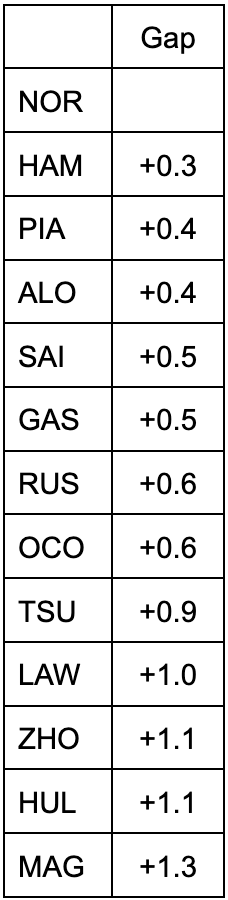
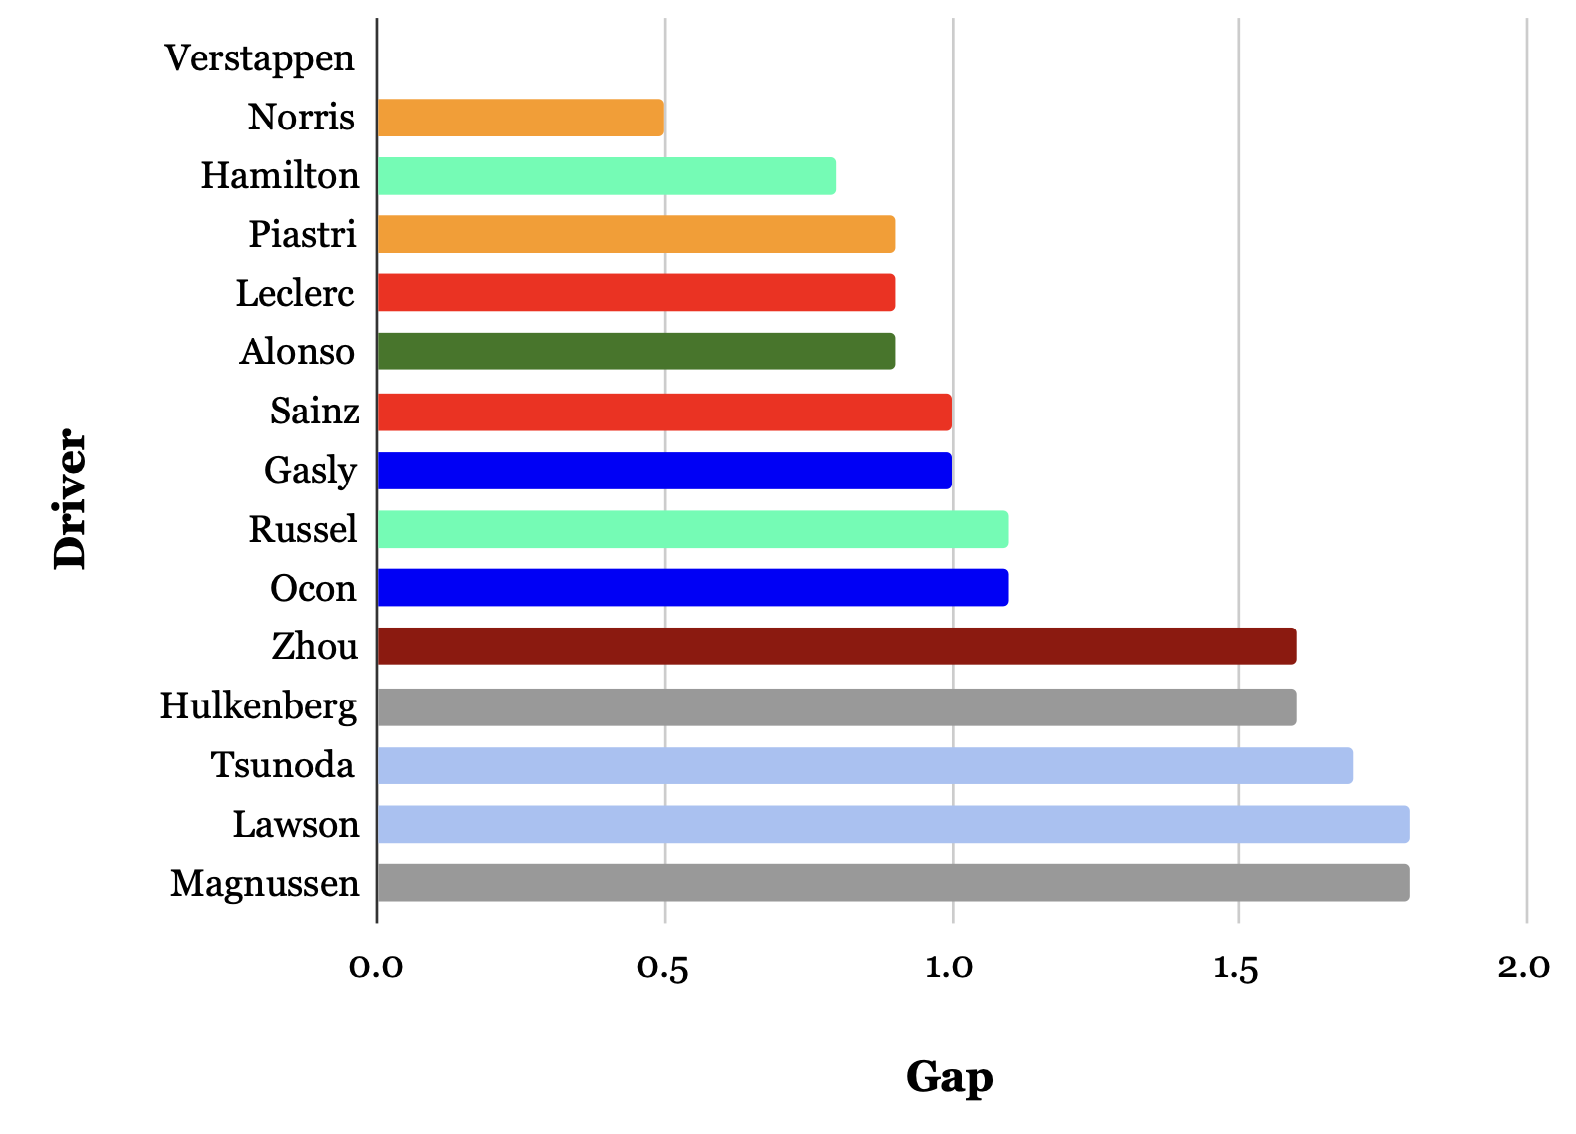
And we got Fig.3 by taking all of these tables together.
Table 3 Overall race pace

Looking Back at the Race Pace
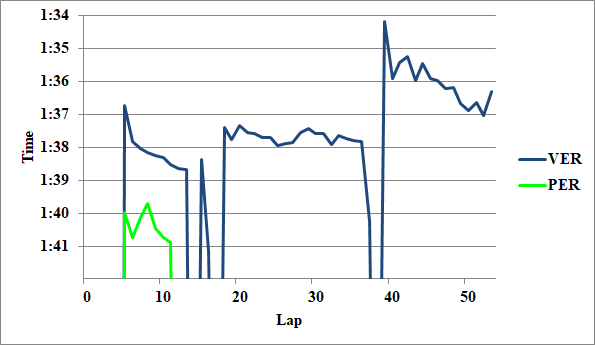
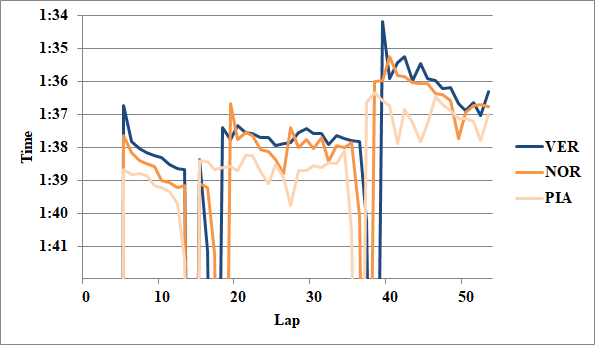
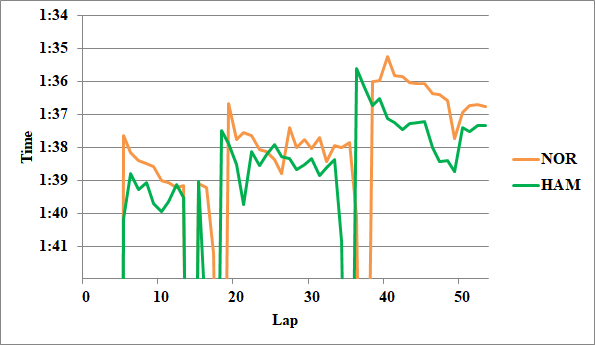
As we saw in qualifying, Verstappen showed an overwhelming pace difference. He was leading throughout the race, so it is questionable how hard he was pushing, and depending on the race situation, he might have shown even higher pace.
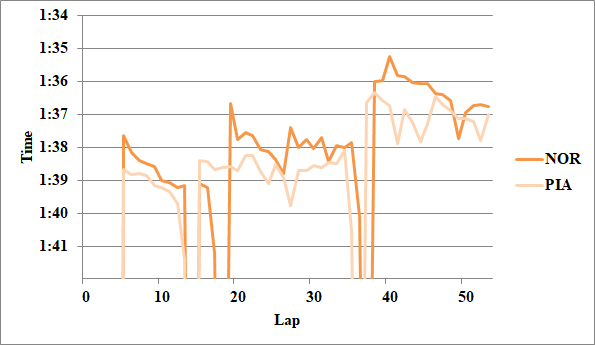
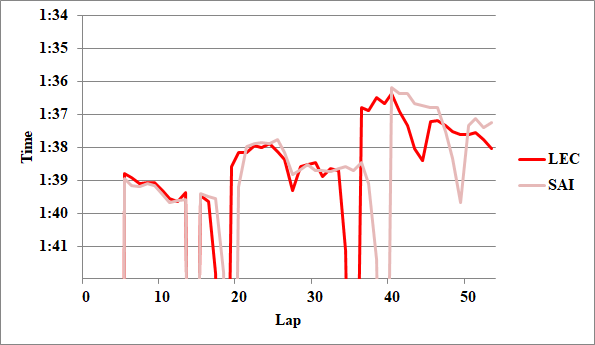
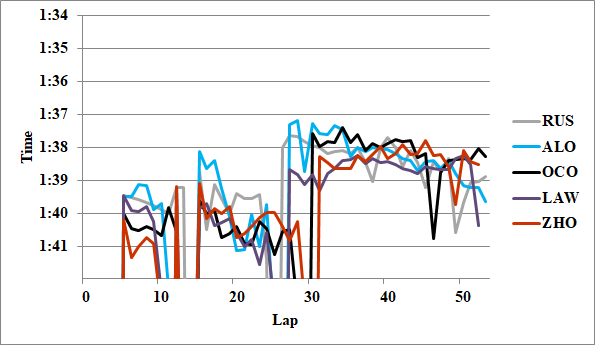
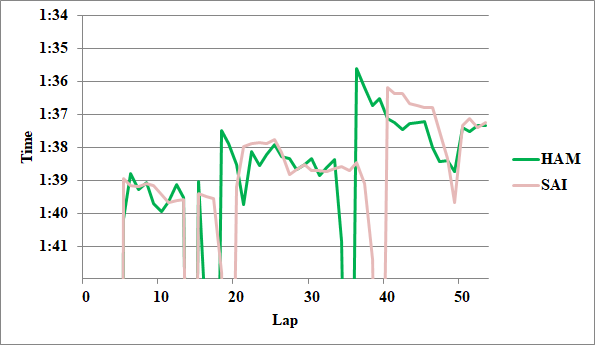
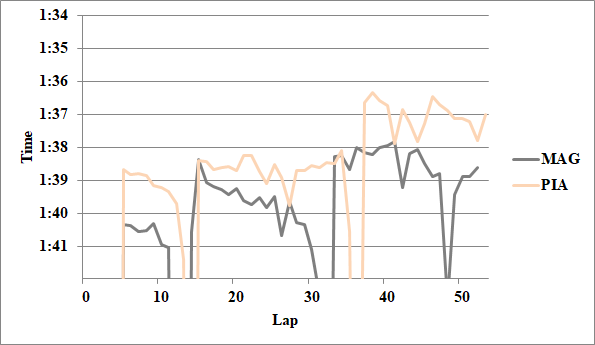
Norris followed Verstappen, but Norris also showed a pace that was far ahead of the group below third place. And below that group, from Hamilton to Ocon, 8 drivers were crowded within 0.3 seconds, as expected from the long run analysis in FP2. In this case, it is important to find a grid position and a strategy that can make use of your own pace. For example, even with the same race pace, Piastri on the podium and Alonso in eighth place had a difference in grid position. And regarding Alonso, losing time behind Ocon in the second stint was a big factor.
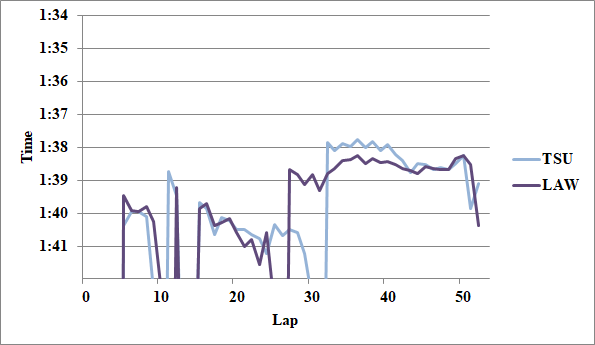
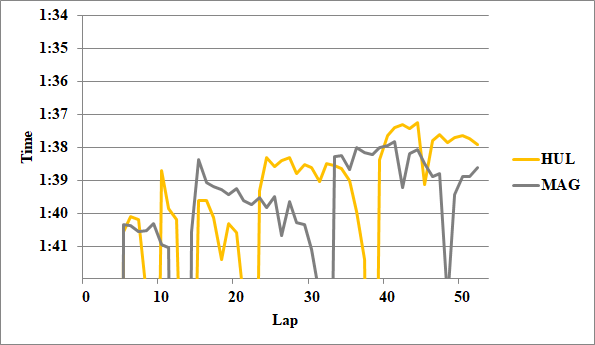
The AlphaTauri drivers showed a decent competitiveness with 0.3 seconds behind Ocon on the hard tyres, but their performance on the medium tyres in the second stint was very poor, and they were left behind by their rivals here. They showed a pace that approached the top runners in the FP2 long run, but they ended up with a good qualifying and poor race performance. The AlphaTauri team has been struggling with finding a balance between qualifying and race setup in recent years, and this year they have taken a more race-oriented approach, but this time they had the opposite tendency.
2. About the Analysis Method
I assumed a fuel effect of 0.08 [s/lap] and calculated the degradation value from the slope of the graph. I derived the race pace in equal conditions from the tyre history. I also took into account clear/dirty air and the context of the race.
The tyres used by each driver (from Pirelli Official)
Also, if a driver was in dirty air in the first half of a stint but in clear air from the middle, and even in dirty air in the first half he was able to save his tyres and did not slow down excessively, I treated the whole stint as if it were clear air. I defined this condition as open-end clear air (OEC).
This time, I ignored the difference between soft tyres used in qualifying and new soft tyres, and scrubbed and new medium/hard tyres.
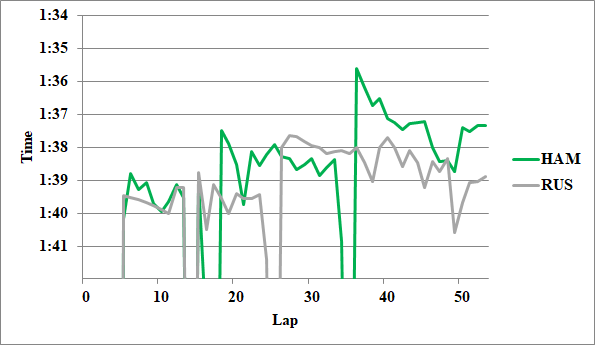
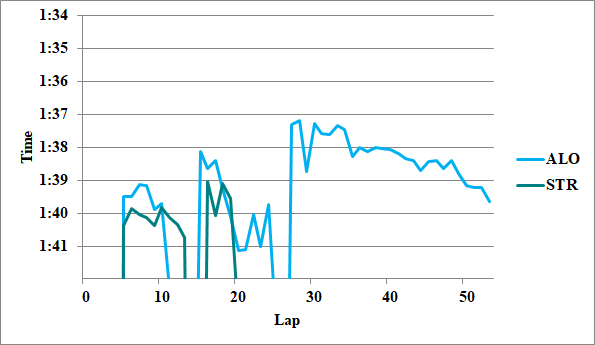
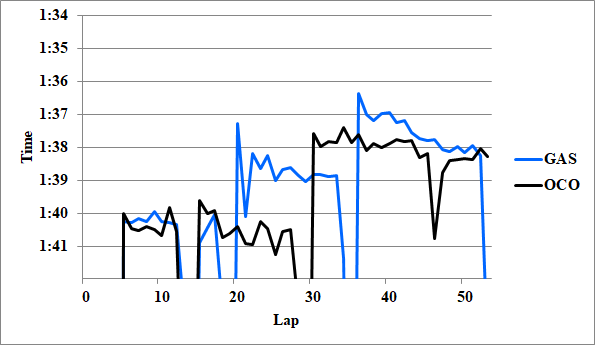
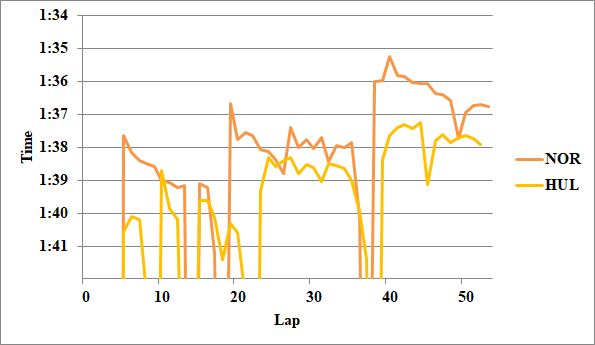
3. Appendix
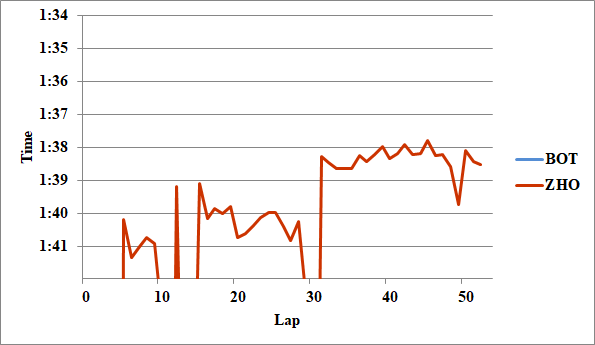
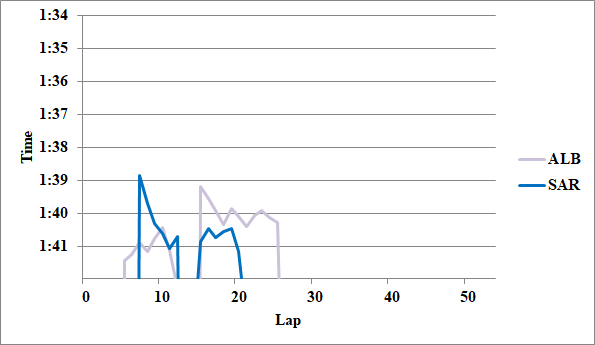
For reference, I attached the graphs I used for analysis.
Writer: Takumi