1. Analysis Results and Conclusions
This is the race pace analysis which considers fuel loads, tyre degradations, and other contexts of the race.
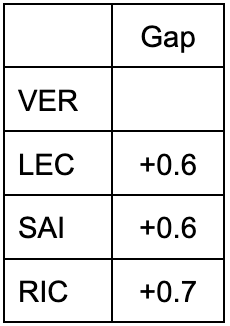
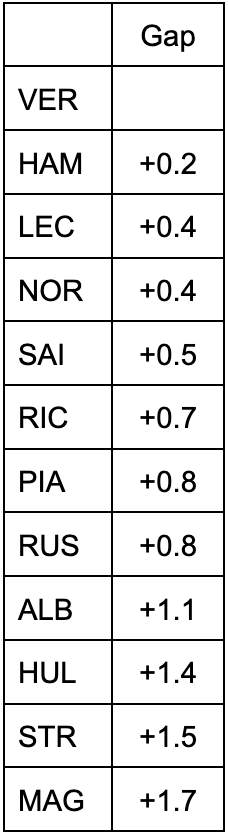
Table 1 and 2 shows power relationship of each car’s race pace in dry conditions.
Table 1 Race pace on medium tyres
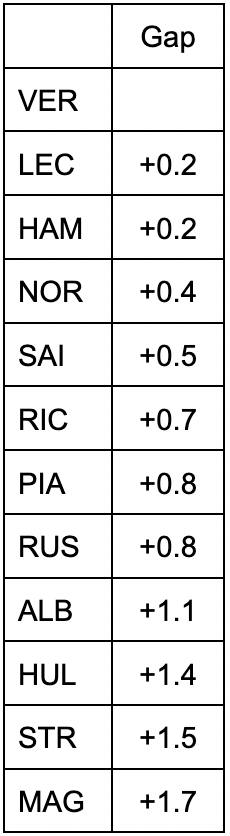
Table 2 Race pace on hard tyres
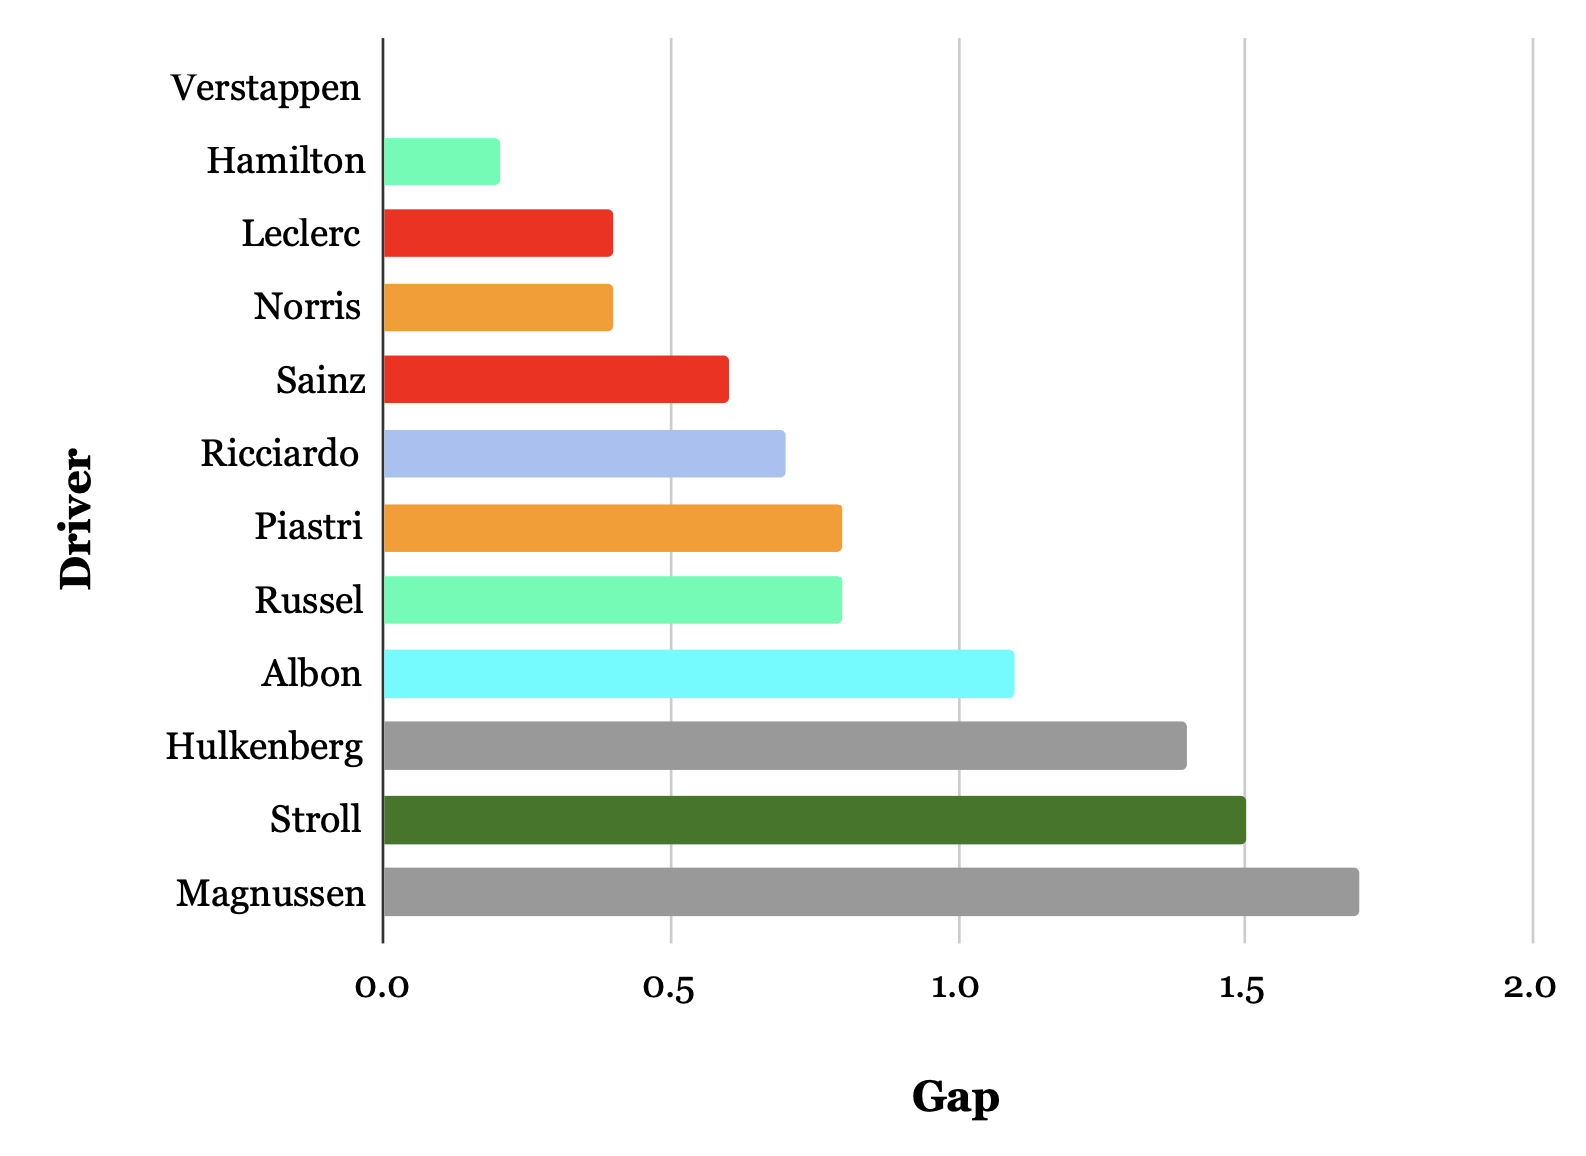
And we got Fig.3 by taking all of these tables together.
Table 3 Overall race pace

Points to note
For the difference in tyre history across the red flag interruption, I adopted the method of counting the laps at racing speed as usual, as it was confirmed that there was no problem with the data of Verstappen, Leclerc, Sainz, Ricciardo and others. (Example: The difference in tyres between Verstappen and Ricciardo is 5 laps at racing speed. Assuming a degradation of 0.05 [s/lap], Verstappen’s tyres have a 0.25 second advantage.)
I excluded Sargeant from the analysis because he had a fuel pump problem, and Alonso because he had damage from Perez’s incident on lap 1.
Also, it should be noted that on this circuit, you can gain about 0.6 seconds by using DRS on the lap you overtake the car ahead.
Looking Back at the Race Pace
In the first stint on medium tyres, Leclerc showed good pace and was close to Verstappen’s performance. However, on hard tyres, he was on par with Sainz and fell far behind Verstappen. It is curious that he had a relative performance drop in the second stint after repairing his front wing damage in the first stint, but it may be that losing front downforce on a rear-limited track actually improved his balance.
Hamilton and Norris both beat their teammates by a large margin respectively.
Also, it is very interesting that Ricciardo is completely dominating as one of the top contenders. I am very curious to see how Ricciardo and AlphaTauri will perform in the remaining three races.
2. About the Analysis Method
I assumed a fuel effect of 0.05 [s/lap] and calculated the degradation value from the slope of the graph. I derived the race pace in equal conditions from the tyre history. I also took into account clear/dirty air and the context of the race.
The tyres used by each driver (from Pirelli Official)
Also, if a driver was in dirty air in the first half of a stint but in clear air from the middle, and even in dirty air in the first half he was able to save his tyres and did not slow down excessively, I treated the whole stint as if it were clear air. I defined this condition as open-end clear air (OEC).
This time, I ignored the difference between soft tyres used in qualifying and new soft tyres, and scrubbed and new medium/hard tyres.
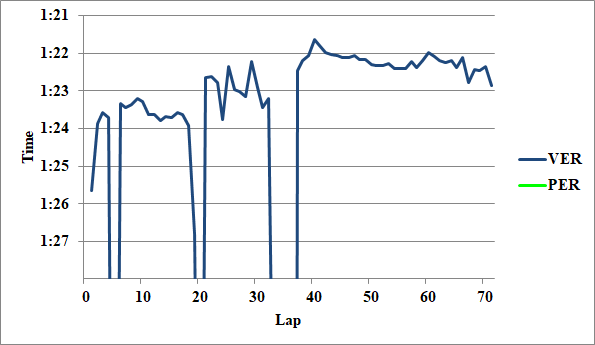
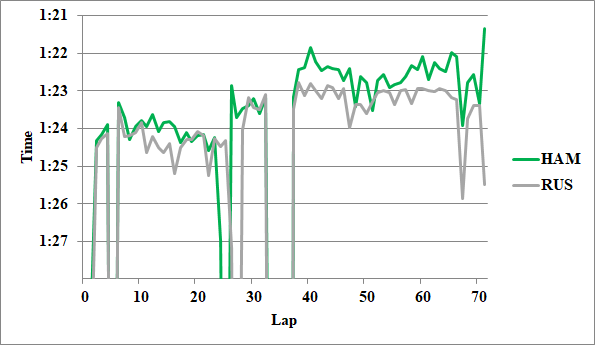
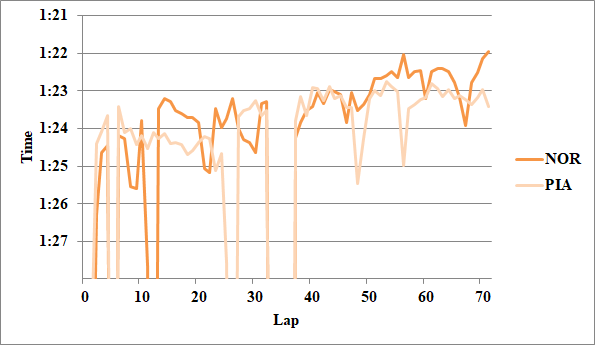
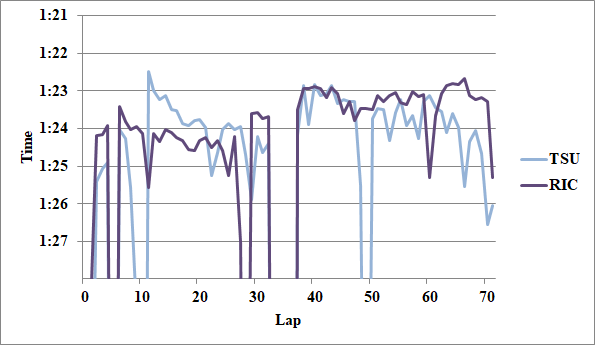
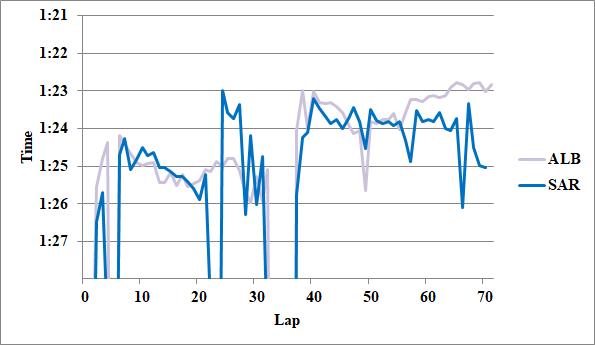
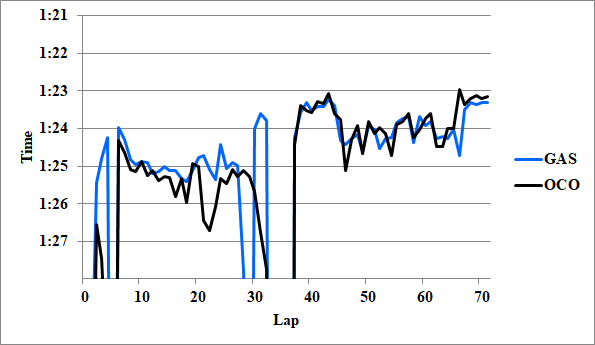
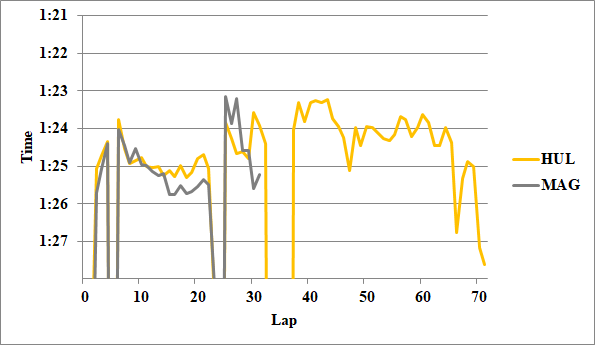
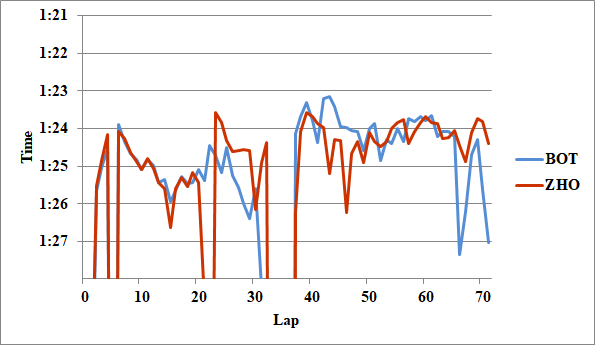
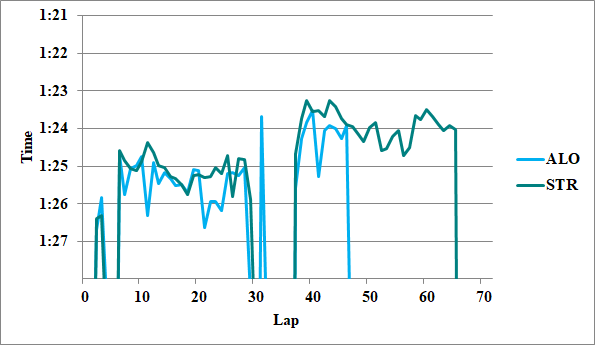
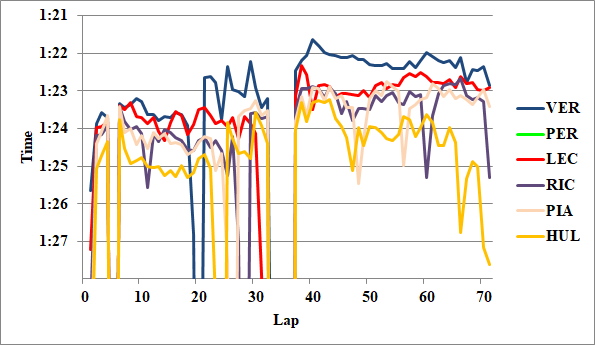
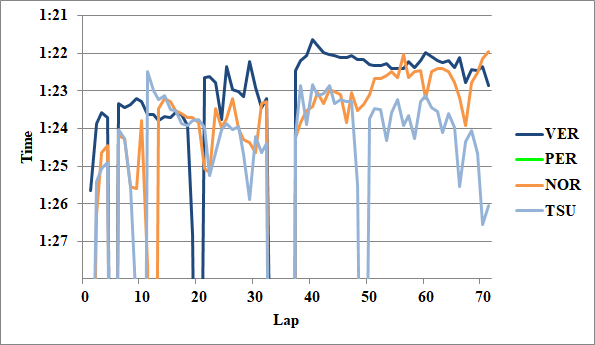
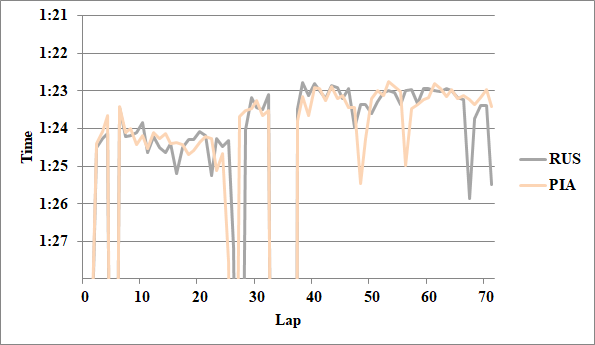
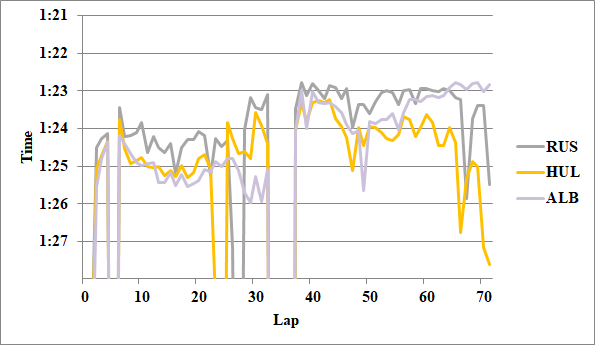
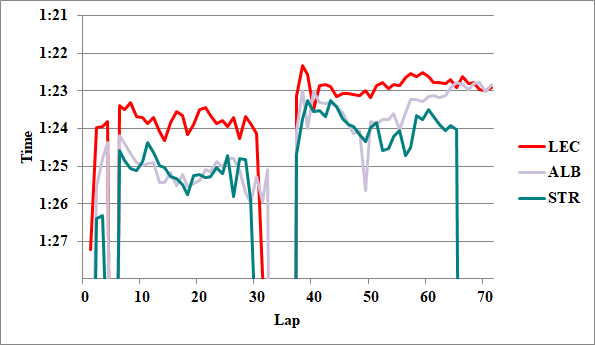
3. Appendix
For reference, I attach the graphs I used for analysis.

Writer: Takumi