1. Analysis Results and Conclusions
This is the race pace analysis which considers fuel loads, tyre degradations, and other contexts of the race.
Table 1 and 2 shows power relationship of each car’s race pace in dry conditions.
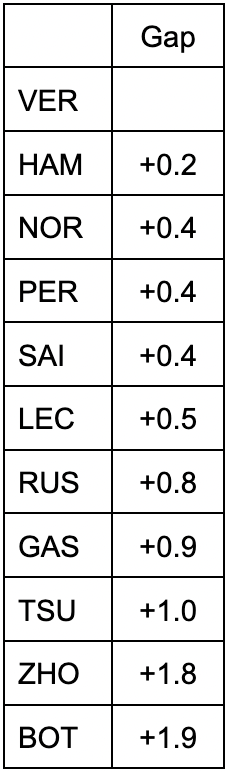
Table 1 Race pace on medium tyres
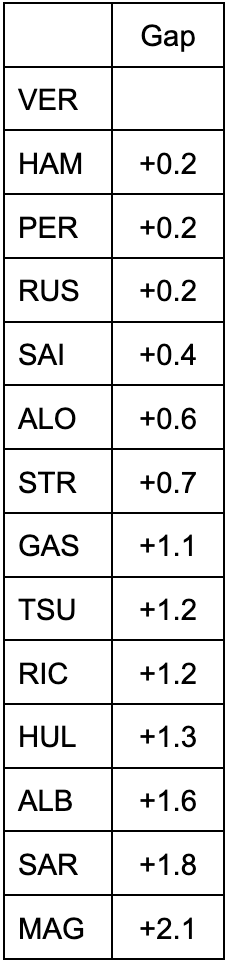
Table 2 Race pace on hard tyres
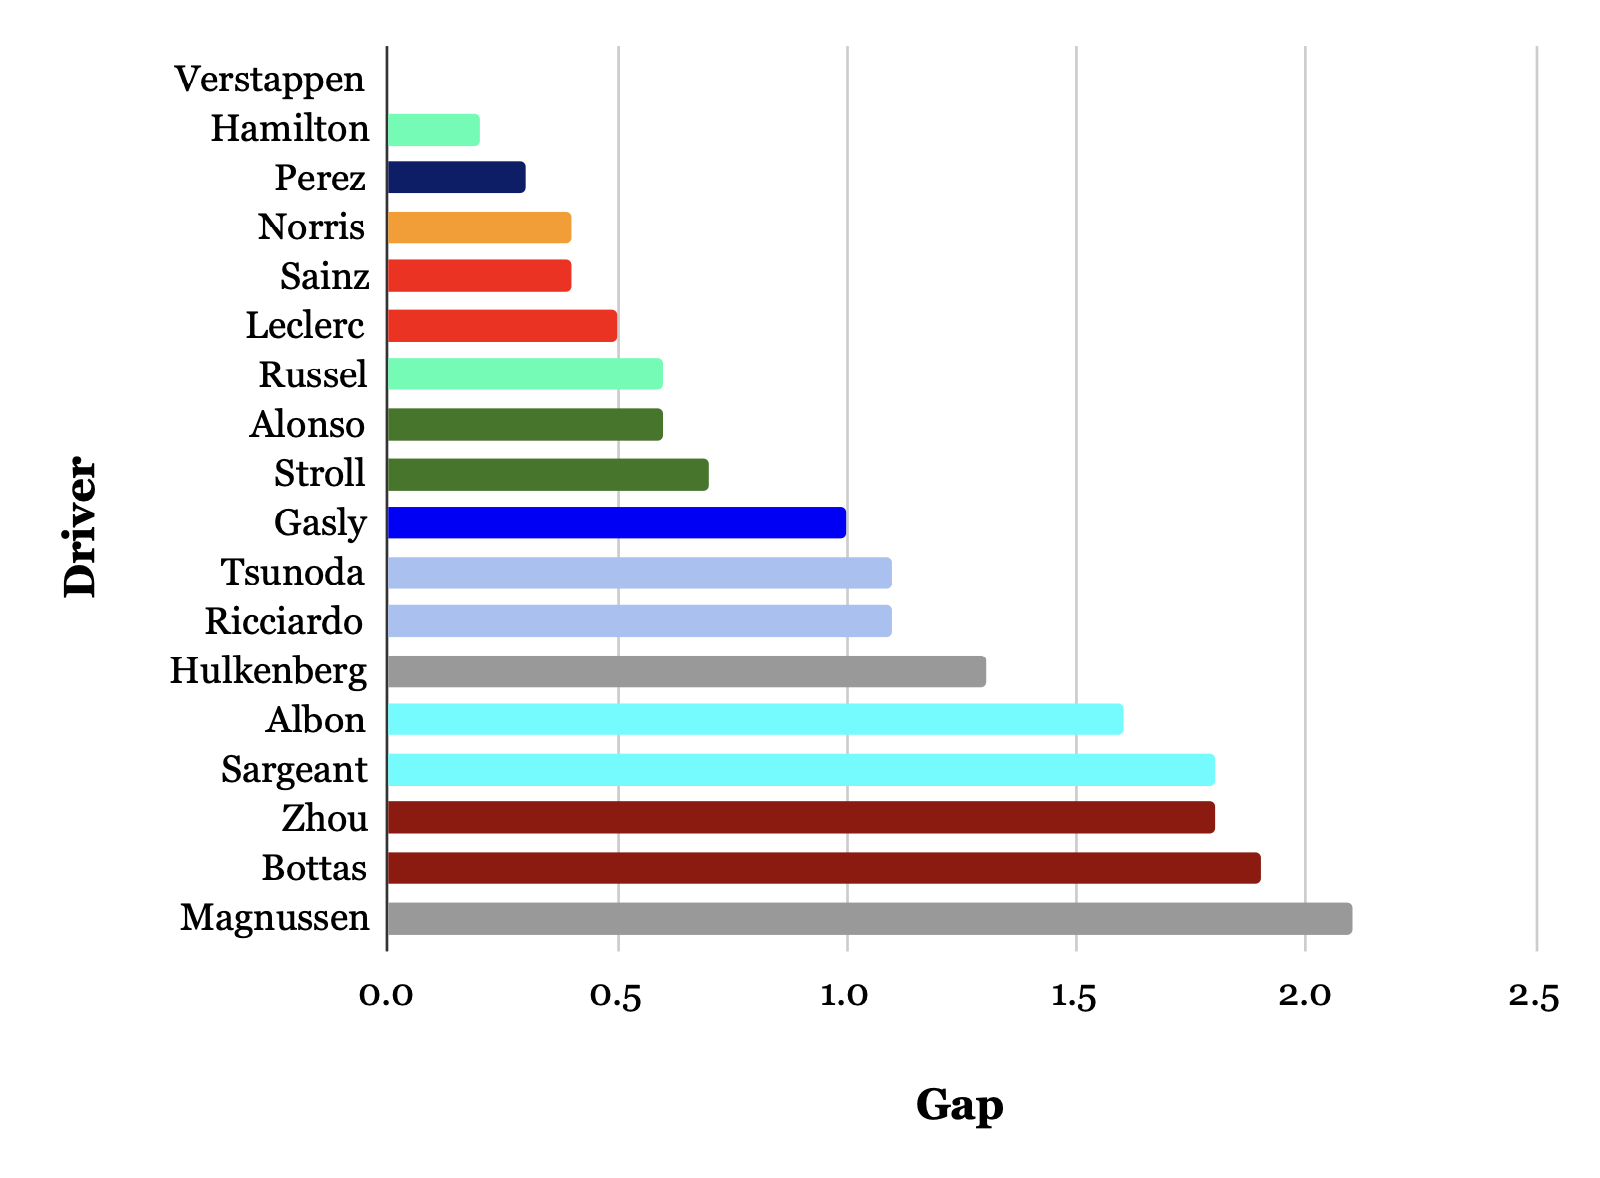
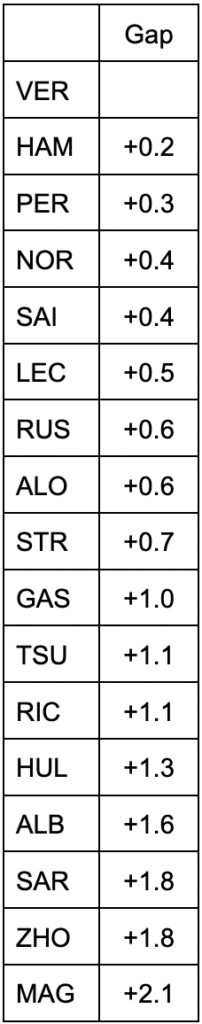
And we got Fig.3 by taking all of these tables together.
Table 3 Overall race pace

Points to note
In regard to Drivers with different performance levels on each tyres, I determine how important was those compounds are in the race based on the ratio of laps on those tyres and reflect it in the overall results. (For example: Russell was 0.2 seconds slower than Verstappen on the mediums and 0.8 seconds slower on the hards. Given that the number of laps on the mediums was about twice as many as on the hards, it was calculated at a 2:1 ratio, making the average 0.6 seconds slower.)
Looking Back at the Race Pace
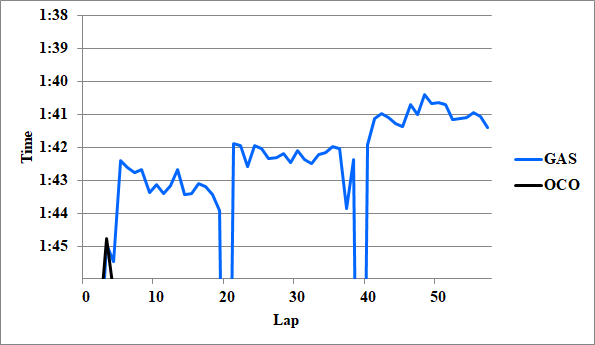
Hamilton’s pace was relatively close to Verstappen this time around. Compared to recent races, Perez was also getting closer to Verstappen. From Verstappen’s radio communications, it was evident he wasn’t particularly happy with the brake feeling, suggesting the weekend might not have been ideal for him. Yet, starting from P6 and clinching the win is truly impressive.
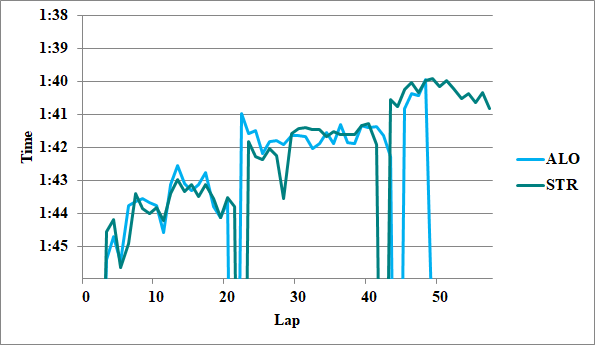
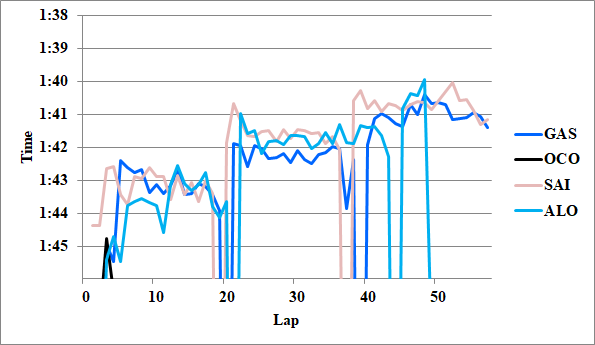
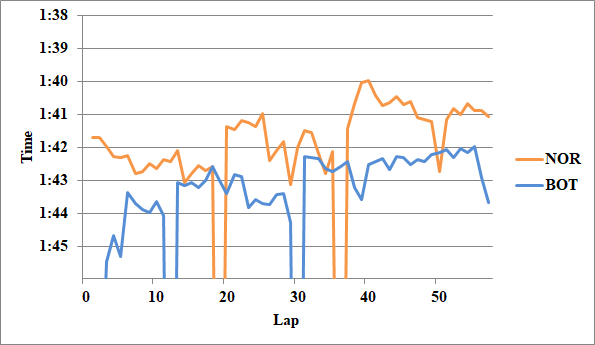
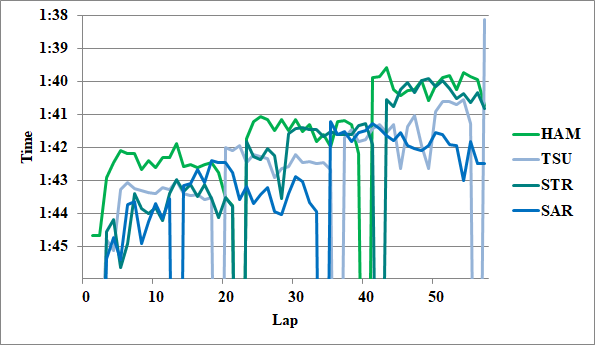
Another intriguing point was with Aston Martin. Typically, there’s about a 0.4 second gap between Alonso and Stroll this season, but this time it was 0.1 seconds which is much closer. Alonso ran with the Qatar-spec, while Stroll used the newest spec. Perhaps the recent updates were a massive success. Due to the limited free practice time, It’s most likely that they couldn’t find the best setup for the upgraded package, leading to a poor qualifying performance. Assuming Alonso was still 0.4 seconds faster than Stroll, he’d be quicker than Norris. Thus, the battle in the drivers’ standings between Hamilton and Alonso, and in the constructors’ standings between McLaren and Aston Martin, looks set to continue heating up.
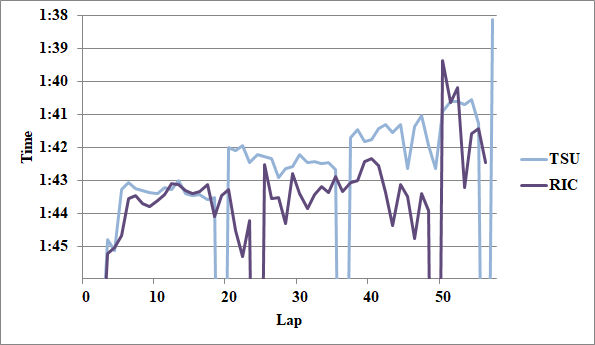
AlfaTauri once again demonstrated a pace competitive with Alpine. Not only securing points and achieving the fastest lap are commendable, but also maintaining a high pace in both qualifying and the race is the real achievement. If they’ve found some kind of knowledge to setup their car, we can look forward to their performance in the remaining four races.
Furthermore, Hulkenberg showcased impressive competitiveness, elevating the usually back-marking Haas to fight within the midfield pack.
2. About the Analysis Method
I assumed a fuel effect of 0.07 [s/lap] and calculated the degradation value from the slope of the graph. I derived the race pace in equal conditions from the tyre history. I also took into account clear/dirty air and the context of the race.
The tyres used by each driver (from Pirelli Official)
Also, if a driver was in dirty air in the first half of a stint but in clear air from the middle, and even in dirty air in the first half he was able to save his tyres and did not slow down excessively, I treated the whole stint as if it were clear air. I defined this condition as open-end clear air (OEC).
This time, I ignored the difference between soft tyres used in qualifying and new soft tyres, and scrubbed and new medium/hard tyres.
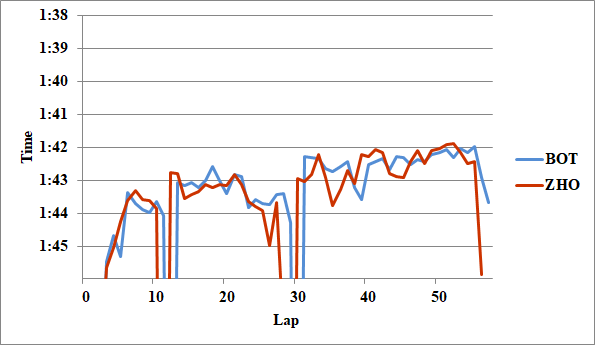
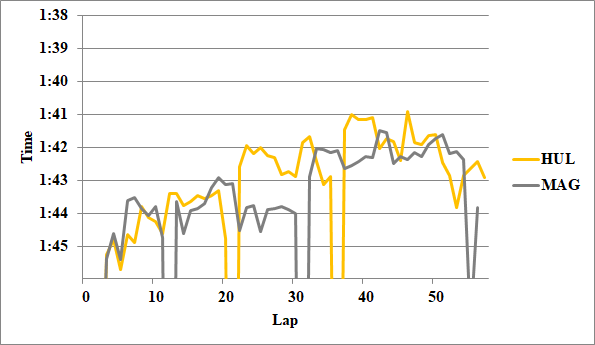
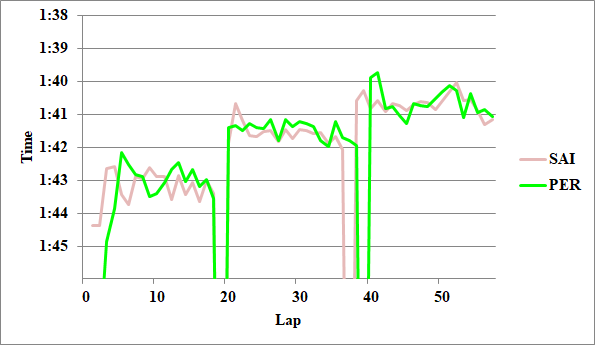
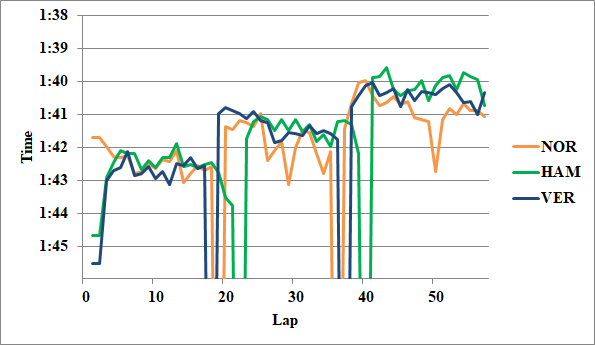
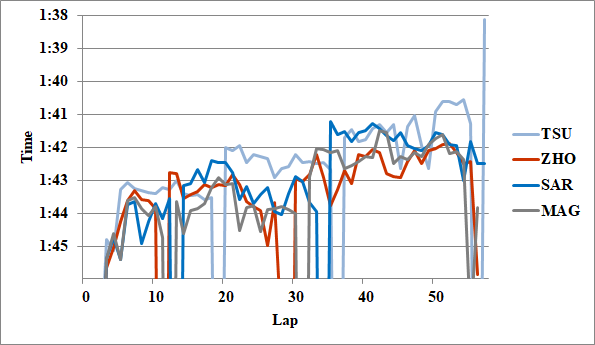
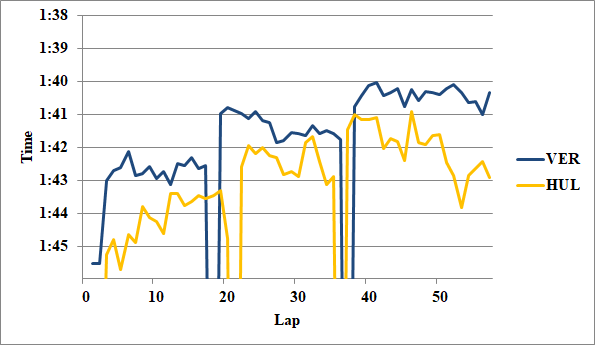
3. Appendix
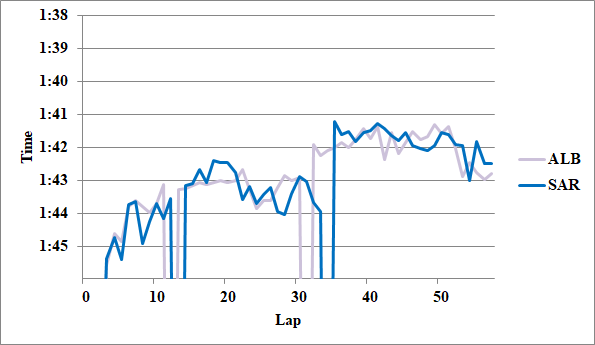
For reference, I attach the graphs I used for analysis.
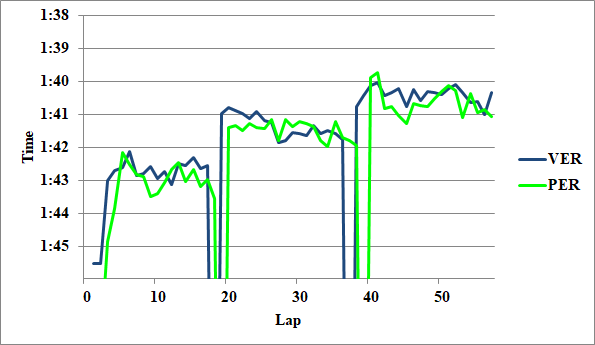
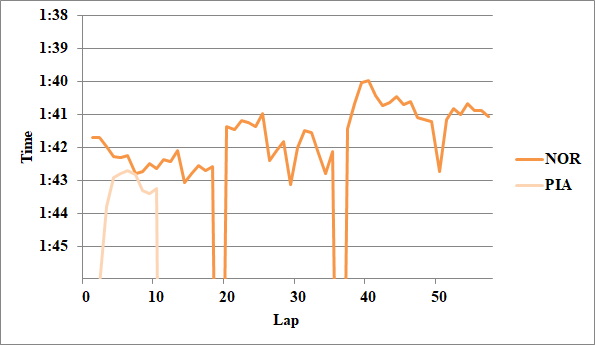
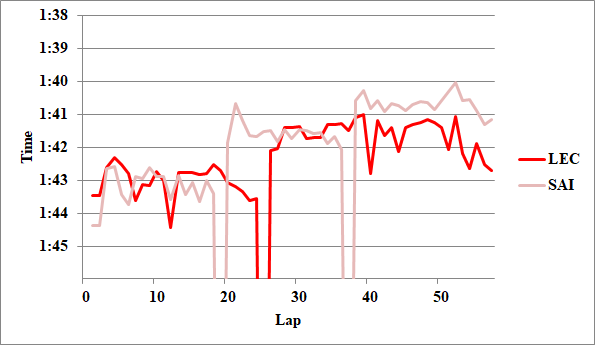
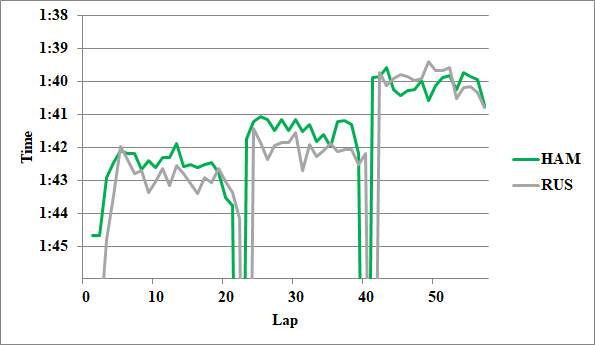
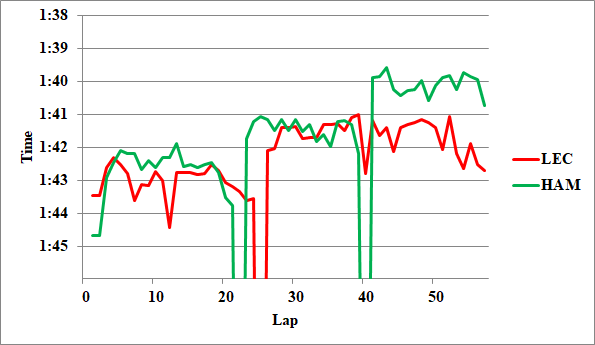
Writer: Takumi