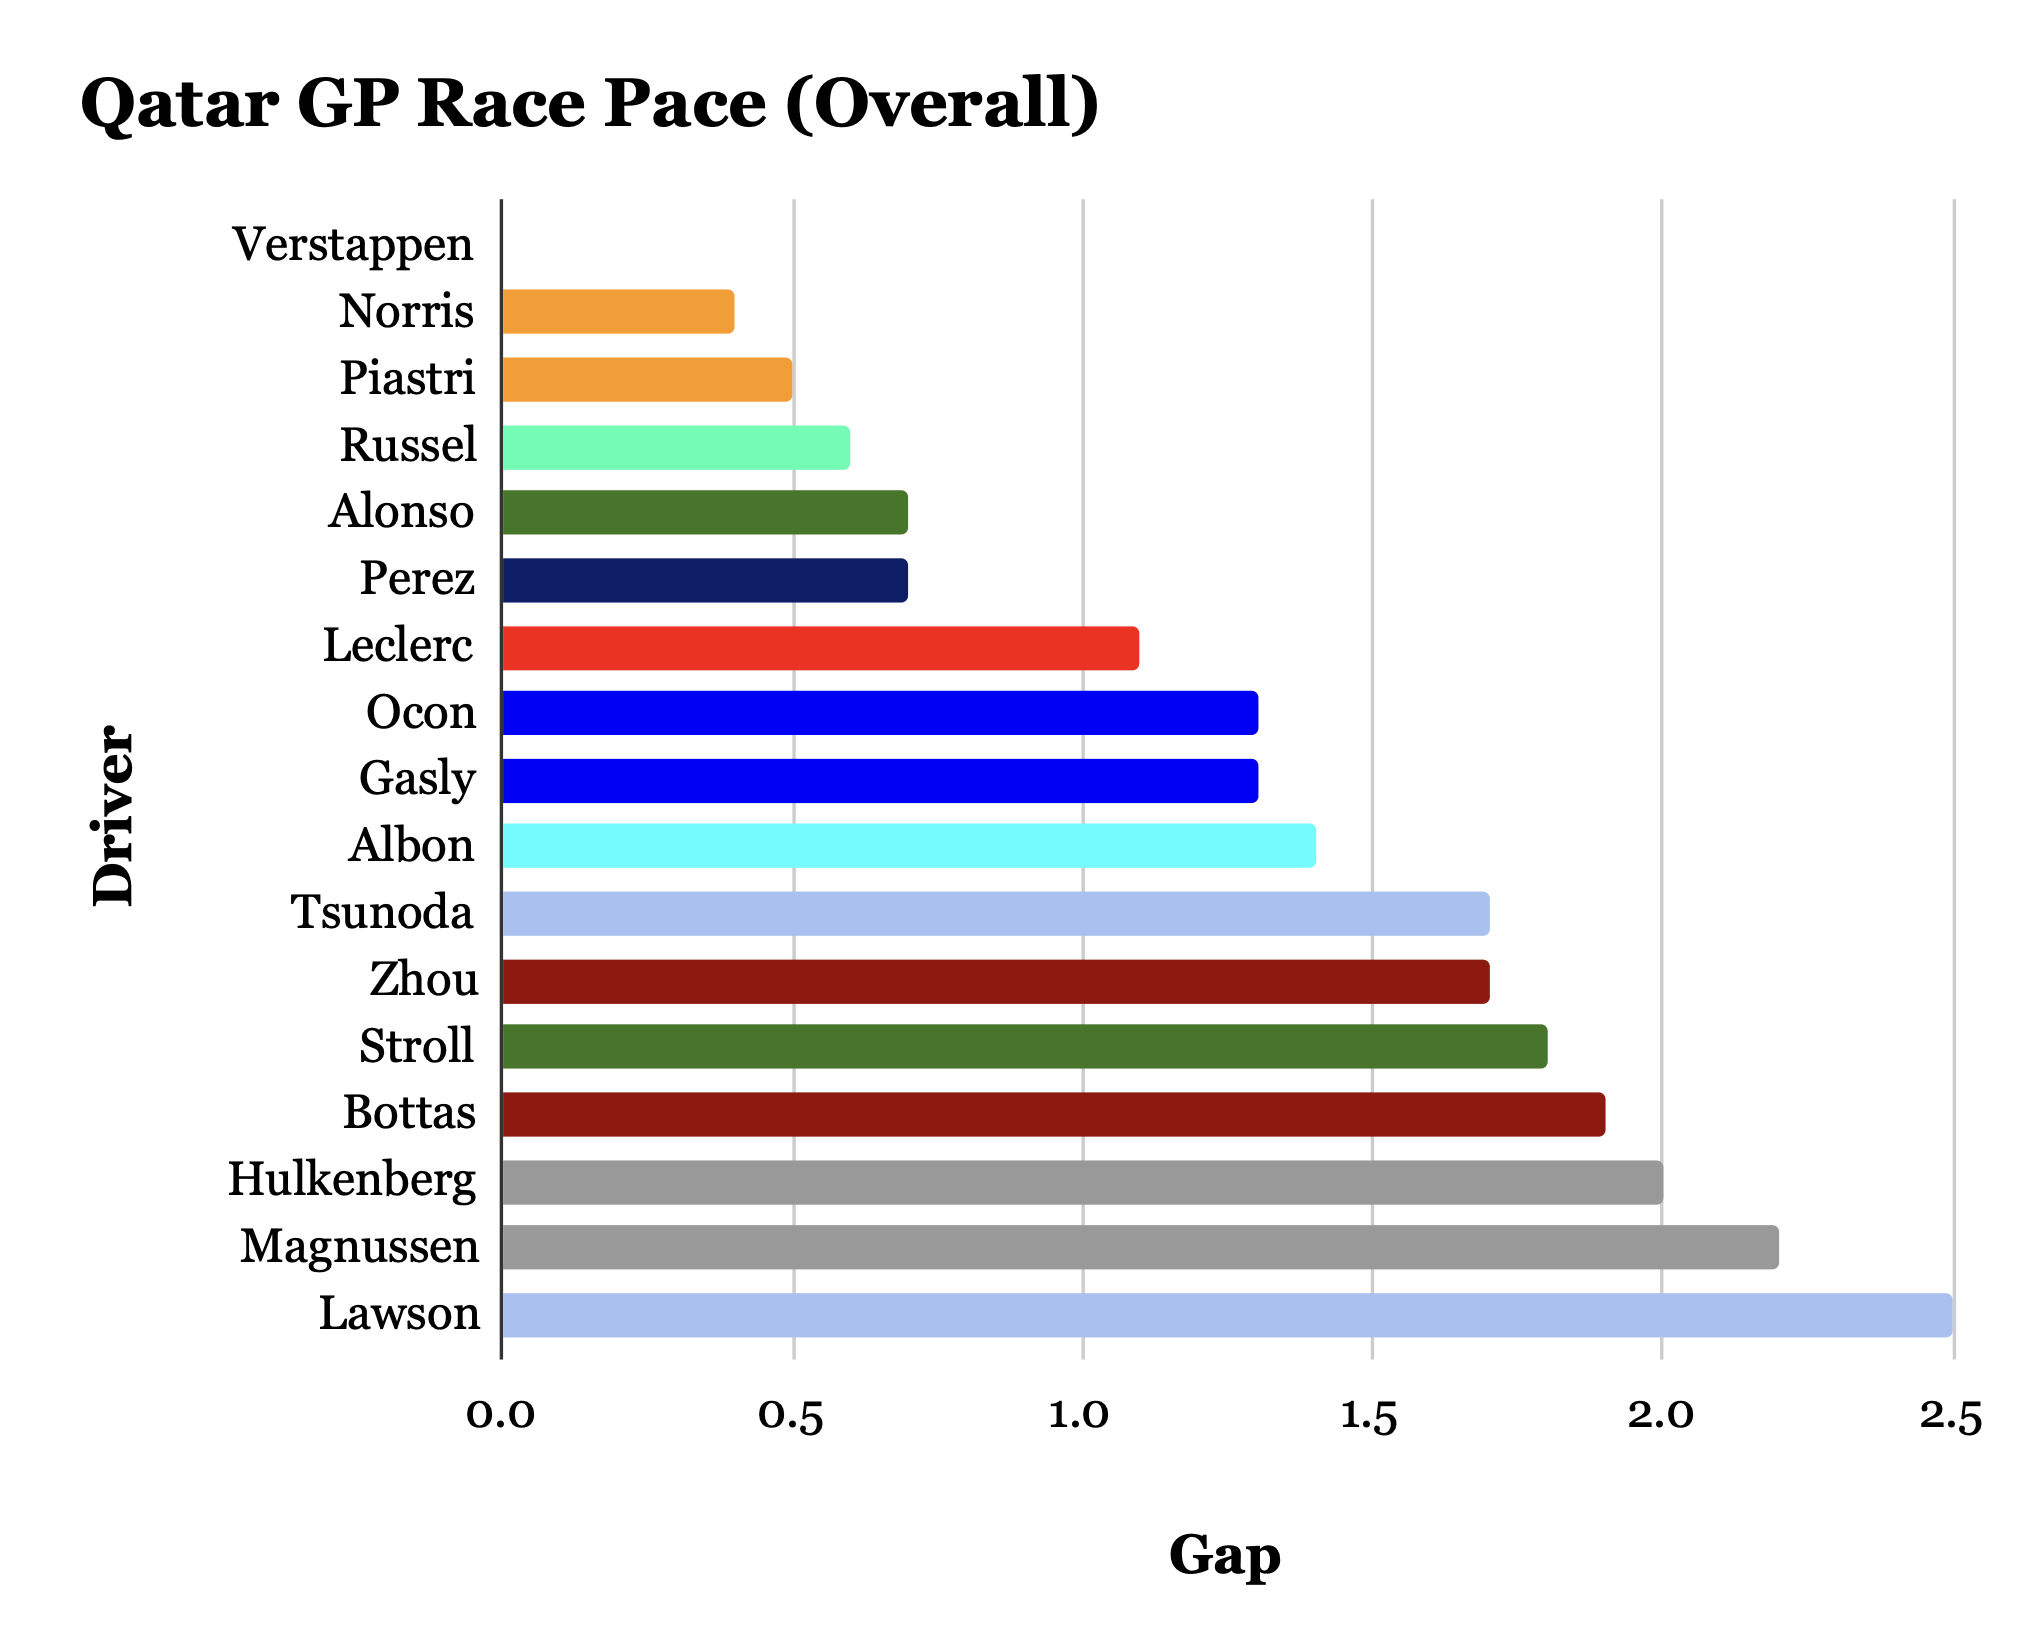
1. Analysis Results and Conclusions
This is the race pace analysis which considers fuel loads, tyre degradations, and other contexts of the race.
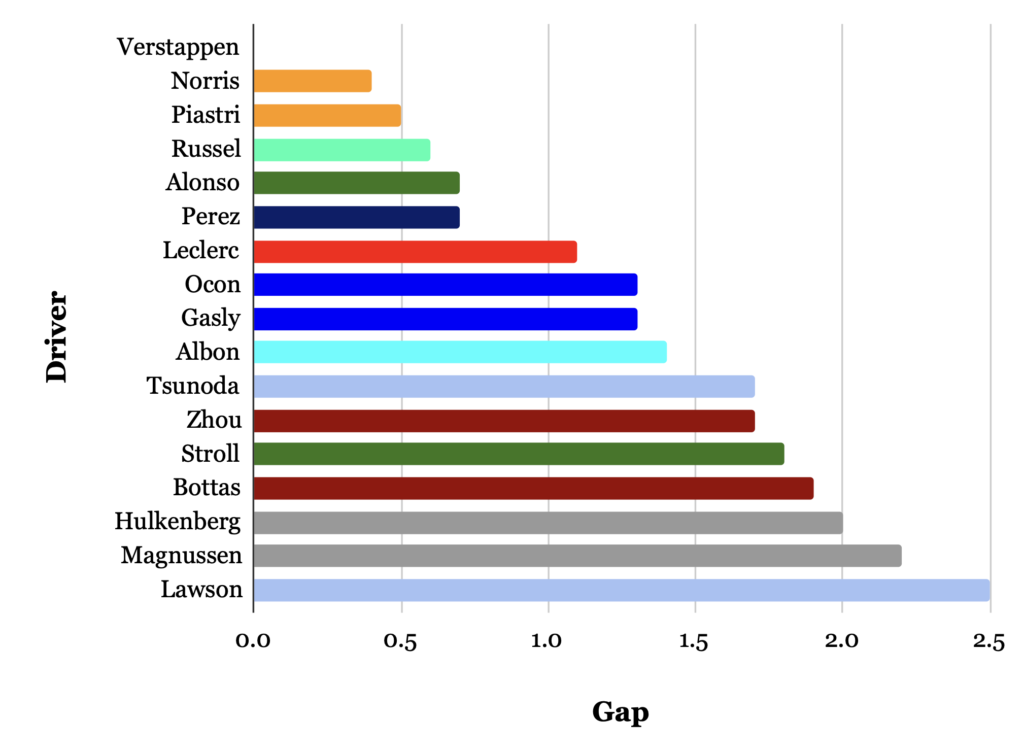
Table 1 and 2 shows power relationship of each car’s race pace in dry conditions.
Table 1 Race pace on medium tyres
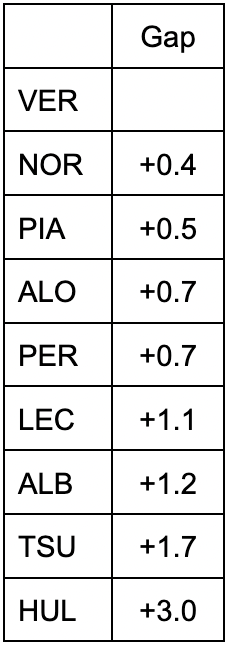
Table 2 Race pace on hard tyres
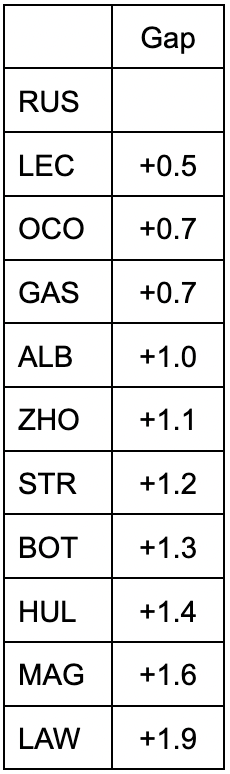
And we got Fig.3 by taking all of these tables together.
Table 3 Overall race pace
Points to note
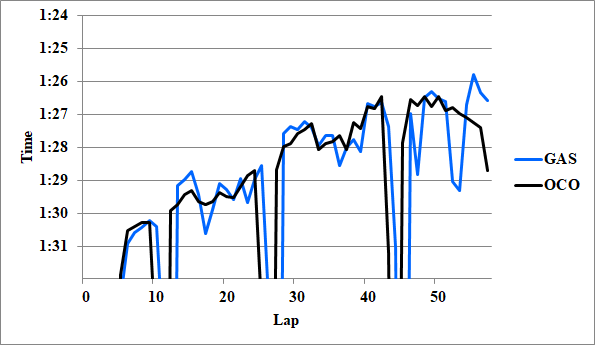
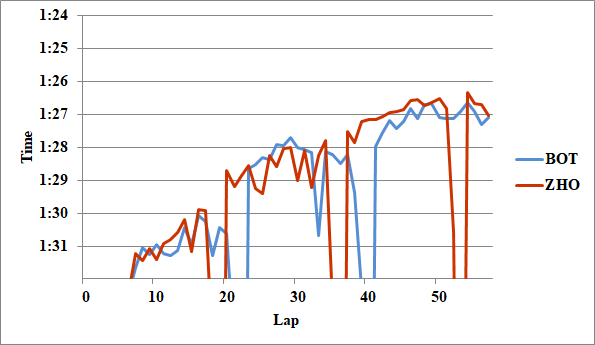
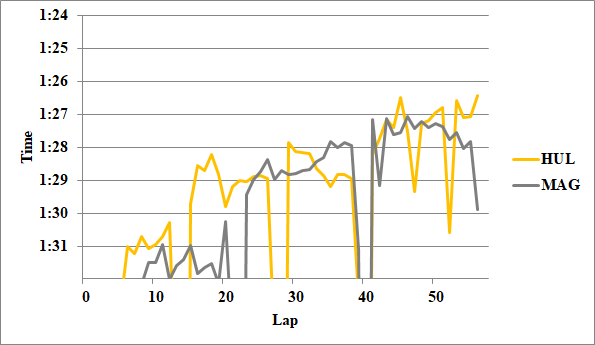
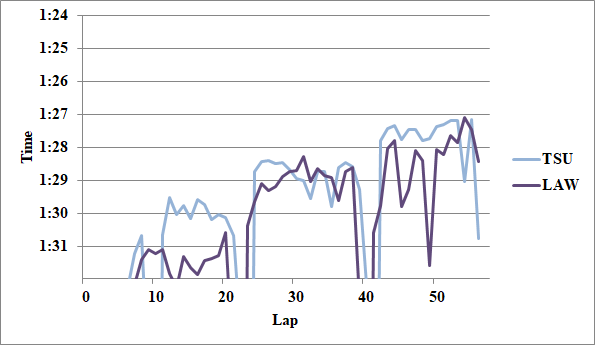
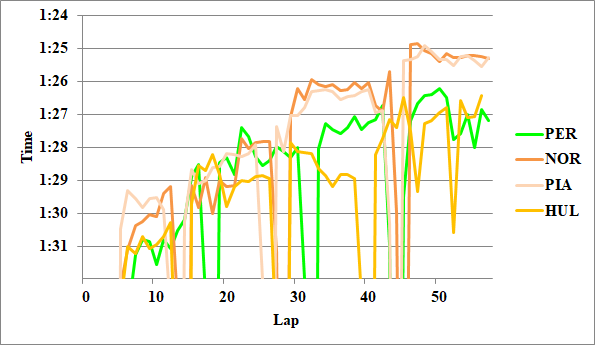
Hulkenberg had a very poor pace on the hard tyres, but I did not use this figure to calculate the overall result, and used only his pace on the medium tyres as the basis. There were also some scenes where the pace deteriorated drastically, such as Perez’s third stint onwards and Tsunoda’s final stint. I also did not consider these as normal values, and calculated the overall race pace without including them.
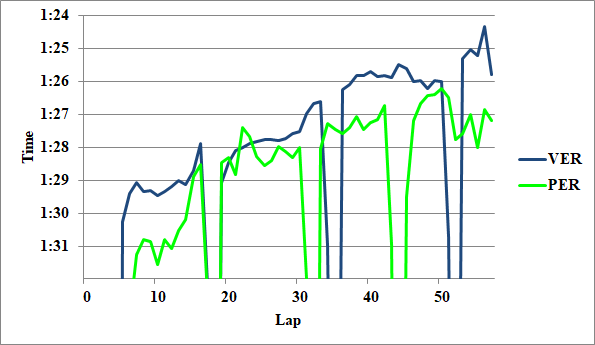
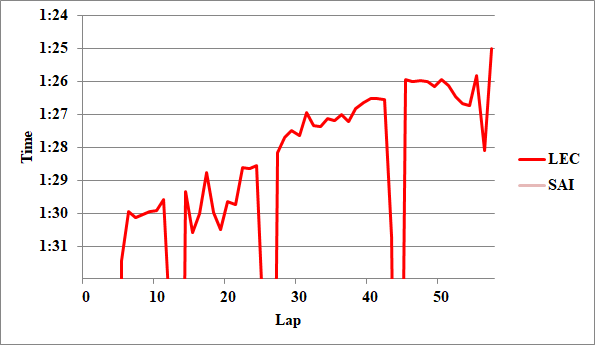
Also, as you can see from the graph in the appendix, Verstappen was still running with some margin (the calculation method is based on the comparison of the average pace of the first stint with Piastri).
Looking Back at the Race Pace
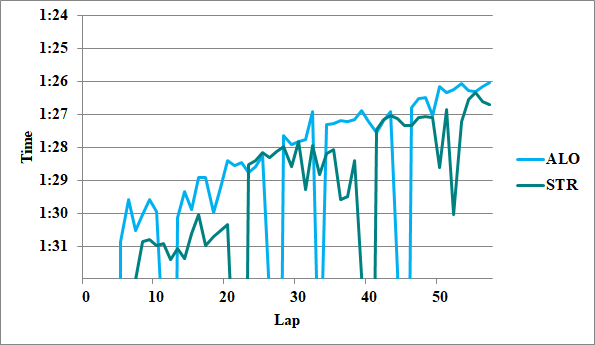
The first thing that was very impressive was that there was a big gap between team-mates, 0.7 seconds for two Red Bulls, 1.1 seconds for Aston Martins and 0.8 seconds for AlphaTauris. It was probably a very difficult condition, but the impact of physical problems due to the heat did not seem to be that big because similar gap can be seen in qualifying, which are less affected by physical aspects. In qualifying, there was also a gap of 0.979 seconds for Red Bull, 1.122 seconds for Aston Martin and 0.577 seconds for AlphaTauri, suggesting that such a big difference was due to factors such as the ultra-high-speed layout and slippery track surface conditions.
In terms of team comparison, McLaren was outstanding and Mercedes was close behind. Hamilton has been very good in race pace this season, beating Russell 9-1, and I wonder what kind of race he would have shown against McLaren if he had been in the mix. It can be said that he wasted a very good opportunity.
Also, one of the characteristics of this power balance was that they are separated into four groups, with Verstappen, other top teams, middle group up to Williams and the lower teams from AlphaTauri onwards. This is visually obvious if you look at Fig.1.
2. About the Analysis Method
I assumed a fuel effect of 0.07 [s/lap] and calculated the degradation value from the slope of the graph. I derived the race pace in equal conditions from the tyre history. I also took into account clear/dirty air and the context of the race.
The tyres used by each driver (from Pirelli Official)
Also, if a driver was in dirty air in the first half of a stint but in clear air from the middle, and even in dirty air in the first half he was able to save his tyres and did not slow down excessively, I treated the whole stint as if it were clear air. I defined this condition as open-end clear air (OEC).
This time, I ignored the difference between soft tyres used in qualifying and new soft tyres, and scrubbed and new medium/hard tyres.
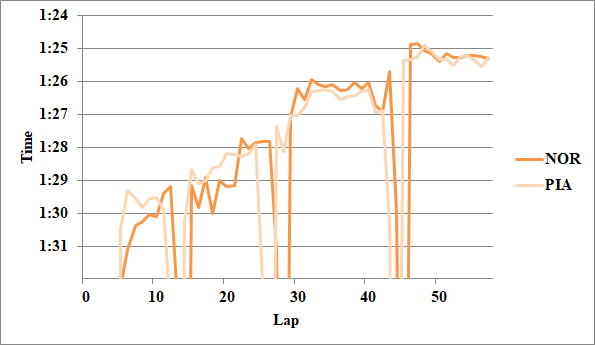
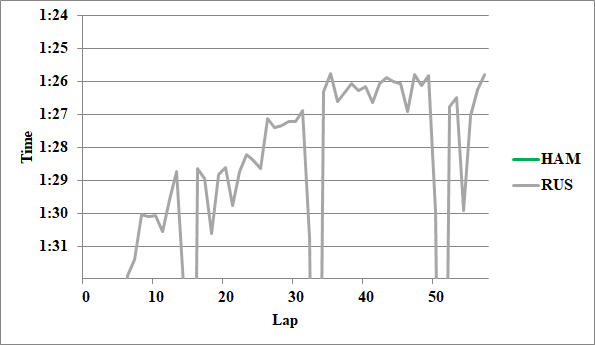
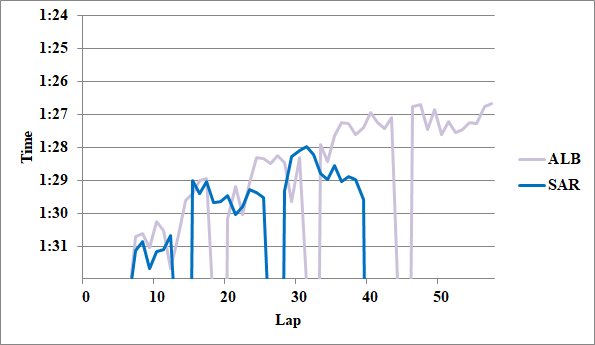
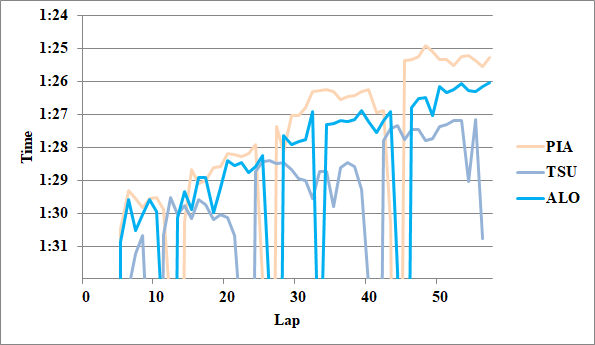
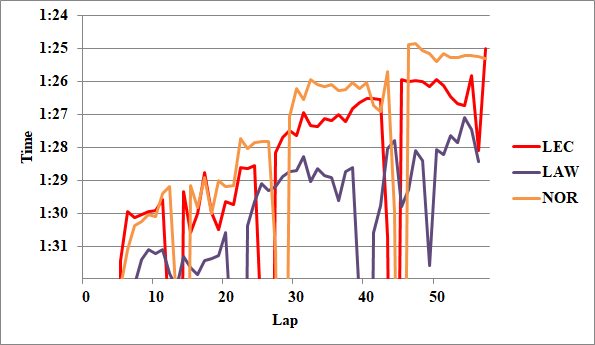
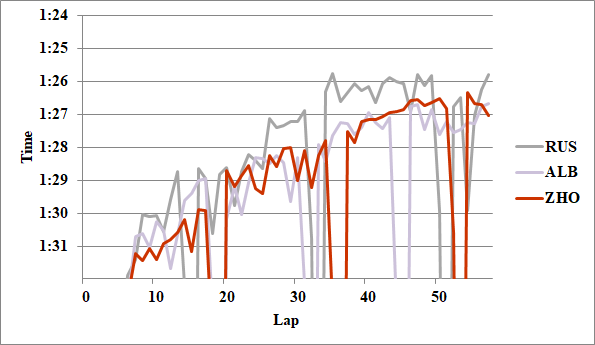
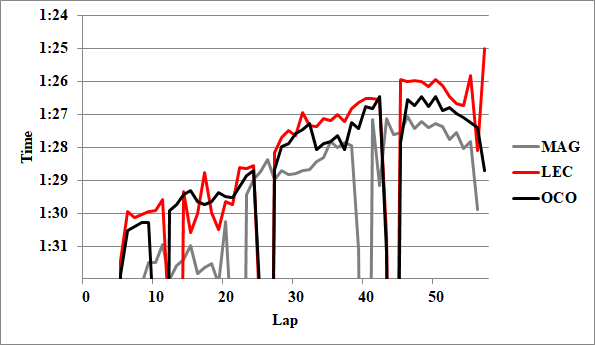
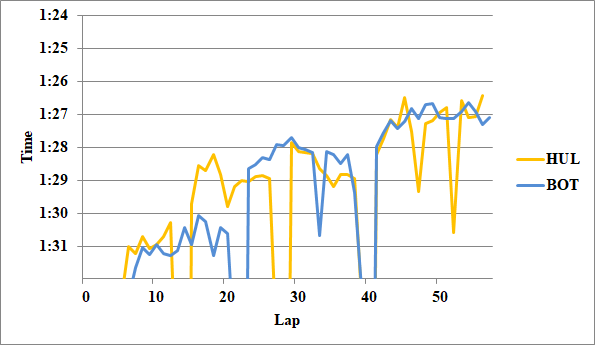
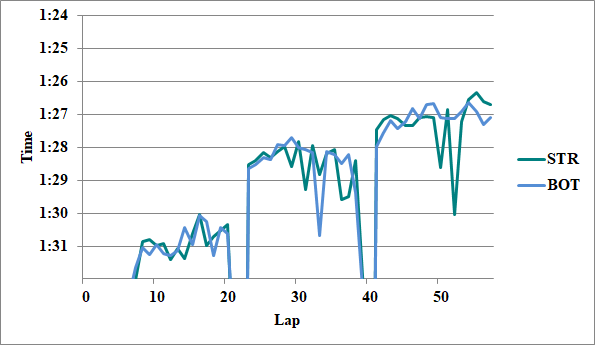
3. Appendix
For reference, I attach the graphs I used for analysis.

Writer: Takumi